- United Arab Emirates
- /
- Insurance
- /
- DFM:SALAMA
Islamic Arab Insurance (Salama) PJSC (DFM:SALAMA) sheds د.إ82m, company earnings and investor returns have been trending downwards for past three years


The truth is that if you invest for long enough, you're going to end up with some losing stocks. Long term Islamic Arab Insurance Co. (Salama) PJSC (DFM:SALAMA) shareholders know that all too well, since the share price is down considerably over three years. Regrettably, they have had to cope with a 60% drop in the share price over that period. And more recent buyers are having a tough time too, with a drop of 44% in the last year. Shareholders have had an even rougher run lately, with the share price down 26% in the last 90 days.
If the past week is anything to go by, investor sentiment for Islamic Arab Insurance (Salama) PJSC isn't positive, so let's see if there's a mismatch between fundamentals and the share price.
See our latest analysis for Islamic Arab Insurance (Salama) PJSC
While the efficient markets hypothesis continues to be taught by some, it has been proven that markets are over-reactive dynamic systems, and investors are not always rational. One flawed but reasonable way to assess how sentiment around a company has changed is to compare the earnings per share (EPS) with the share price.
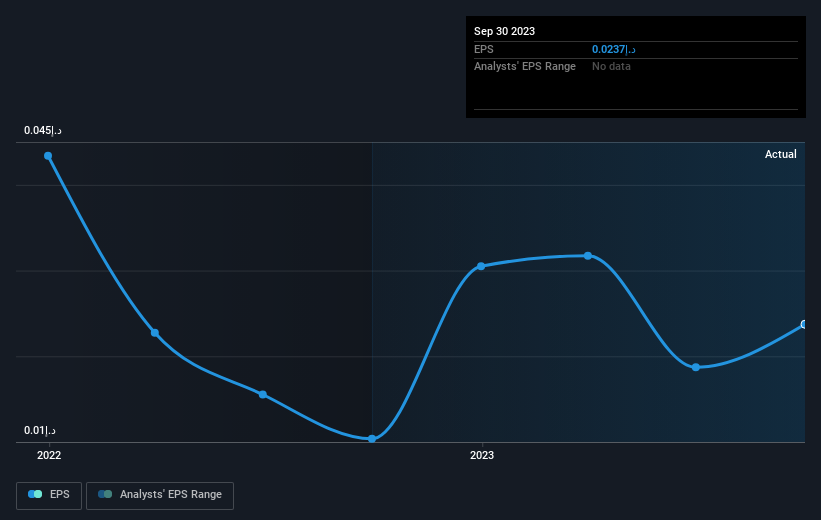
During the three years that the share price fell, Islamic Arab Insurance (Salama) PJSC's earnings per share (EPS) dropped by 46% each year. This fall in the EPS is worse than the 26% compound annual share price fall. So, despite the prior disappointment, shareholders must have some confidence the situation will improve, longer term.
The graphic below depicts how EPS has changed over time (unveil the exact values by clicking on the image).
Before buying or selling a stock, we always recommend a close examination of historic growth trends, available here.
What About Dividends?
When looking at investment returns, it is important to consider the difference between total shareholder return (TSR) and share price return. The TSR incorporates the value of any spin-offs or discounted capital raisings, along with any dividends, based on the assumption that the dividends are reinvested. So for companies that pay a generous dividend, the TSR is often a lot higher than the share price return. In the case of Islamic Arab Insurance (Salama) PJSC, it has a TSR of -55% for the last 3 years. That exceeds its share price return that we previously mentioned. And there's no prize for guessing that the dividend payments largely explain the divergence!
A Different Perspective
Islamic Arab Insurance (Salama) PJSC shareholders are down 44% for the year (even including dividends), but the market itself is up 2.9%. However, keep in mind that even the best stocks will sometimes underperform the market over a twelve month period. Regrettably, last year's performance caps off a bad run, with the shareholders facing a total loss of 0.7% per year over five years. Generally speaking long term share price weakness can be a bad sign, though contrarian investors might want to research the stock in hope of a turnaround. While it is well worth considering the different impacts that market conditions can have on the share price, there are other factors that are even more important. Consider risks, for instance. Every company has them, and we've spotted 2 warning signs for Islamic Arab Insurance (Salama) PJSC you should know about.
If you would prefer to check out another company -- one with potentially superior financials -- then do not miss this free list of companies that have proven they can grow earnings.
Please note, the market returns quoted in this article reflect the market weighted average returns of stocks that currently trade on Emirian exchanges.
If you're looking to trade Islamic Arab Insurance (Salama) PJSC, open an account with the lowest-cost platform trusted by professionals, Interactive Brokers.
With clients in over 200 countries and territories, and access to 160 markets, IBKR lets you trade stocks, options, futures, forex, bonds and funds from a single integrated account.
Enjoy no hidden fees, no account minimums, and FX conversion rates as low as 0.03%, far better than what most brokers offer.
Sponsored ContentNew: AI Stock Screener & Alerts
Our new AI Stock Screener scans the market every day to uncover opportunities.
• Dividend Powerhouses (3%+ Yield)
• Undervalued Small Caps with Insider Buying
• High growth Tech and AI Companies
Or build your own from over 50 metrics.
Have feedback on this article? Concerned about the content? Get in touch with us directly. Alternatively, email editorial-team (at) simplywallst.com.
This article by Simply Wall St is general in nature. We provide commentary based on historical data and analyst forecasts only using an unbiased methodology and our articles are not intended to be financial advice. It does not constitute a recommendation to buy or sell any stock, and does not take account of your objectives, or your financial situation. We aim to bring you long-term focused analysis driven by fundamental data. Note that our analysis may not factor in the latest price-sensitive company announcements or qualitative material. Simply Wall St has no position in any stocks mentioned.
About DFM:SALAMA
Islamic Arab Insurance (Salama) PJSC
Provides a range of general, family, health, and auto takaful solutions in Africa and Asia.
Excellent balance sheet and slightly overvalued.
