Advertisement
- United States
- /
- Hospitality
- /
- NasdaqGS:RRR
Is Red Rock Resorts (NASDAQ:RRR) Using Too Much Debt?
Legendary fund manager Li Lu (who Charlie Munger backed) once said, 'The biggest investment risk is not the volatility of prices, but whether you will suffer a permanent loss of capital.' When we think about how risky a company is, we always like to look at its use of debt, since debt overload can lead to ruin. We note that Red Rock Resorts, Inc. (NASDAQ:RRR) does have debt on its balance sheet. But should shareholders be worried about its use of debt?
Why Does Debt Bring Risk?
Generally speaking, debt only becomes a real problem when a company can't easily pay it off, either by raising capital or with its own cash flow. In the worst case scenario, a company can go bankrupt if it cannot pay its creditors. However, a more common (but still painful) scenario is that it has to raise new equity capital at a low price, thus permanently diluting shareholders. Of course, debt can be an important tool in businesses, particularly capital heavy businesses. The first step when considering a company's debt levels is to consider its cash and debt together.
See our latest analysis for Red Rock Resorts
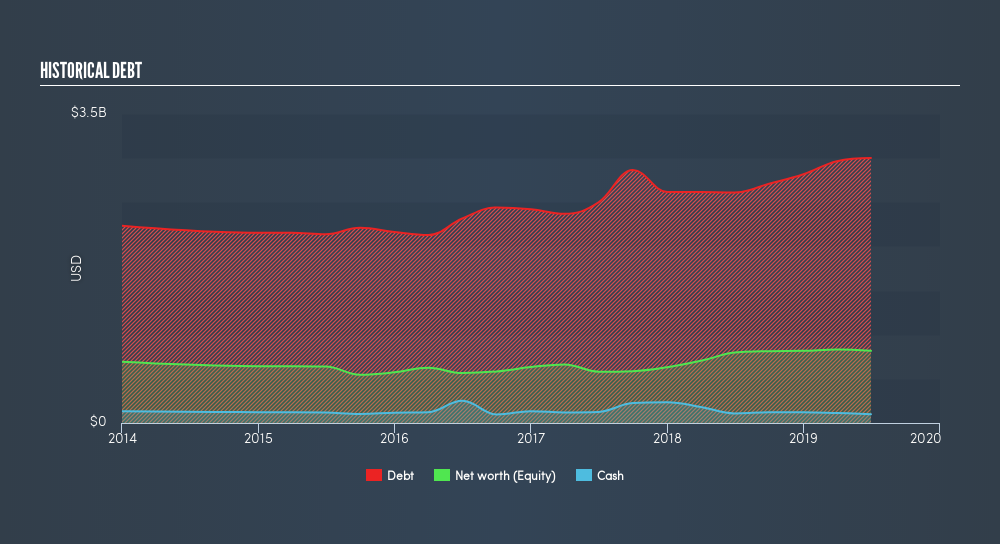
How Much Debt Does Red Rock Resorts Carry?
The image below, which you can click on for greater detail, shows that at June 2019 Red Rock Resorts had debt of US$3.00b, up from US$2.61b in one year. On the flip side, it has US$100.5m in cash leading to net debt of about US$2.90b.
How Strong Is Red Rock Resorts's Balance Sheet?
Zooming in on the latest balance sheet data, we can see that Red Rock Resorts had liabilities of US$297.3m due within 12 months and liabilities of US$3.01b due beyond that. Offsetting these obligations, it had cash of US$100.5m as well as receivables valued at US$53.4m due within 12 months. So it has liabilities totalling US$3.16b more than its cash and near-term receivables, combined.
When you consider that this deficiency exceeds the company's US$2.23b market capitalization, you might well be inclined to review the balance sheet, just like one might study a new partner's social media. In the scenario where the company had to clean up its balance sheet quickly, it seems likely shareholders would suffer extensive dilution.
In order to size up a company's debt relative to its earnings, we calculate its net debt divided by its earnings before interest, tax, depreciation, and amortization (EBITDA) and its earnings before interest and tax (EBIT) divided by its interest expense (its interest cover). Thus we consider debt relative to earnings both with and without depreciation and amortization expenses.
Weak interest cover of 1.4 times and a disturbingly high net debt to EBITDA ratio of 5.9 hit our confidence in Red Rock Resorts like a one-two punch to the gut. This means we'd consider it to have a heavy debt load. Investors should also be troubled by the fact that Red Rock Resorts saw its EBIT drop by 10% over the last twelve months. If things keep going like that, handling the debt will about as easy as bundling an angry house cat into its travel box. There's no doubt that we learn most about debt from the balance sheet. But ultimately the future profitability of the business will decide if Red Rock Resorts can strengthen its balance sheet over time. So if you want to see what the professionals think, you might find this free report on analyst profit forecasts to be interesting.
But our final consideration is also important, because a company cannot pay debt with paper profits; it needs cold hard cash. So the logical step is to look at the proportion of that EBIT that is matched by actual free cash flow. During the last three years, Red Rock Resorts burned a lot of cash. While that may be a result of expenditure for growth, it does make the debt far more risky.
Our View
On the face of it, Red Rock Resorts's net debt to EBITDA left us tentative about the stock, and its conversion of EBIT to free cash flow was no more enticing than the one empty restaurant on the busiest night of the year. And even its level of total liabilities fails to inspire much confidence. Considering all the factors previously mentioned, we think that Red Rock Resorts really is carrying too much debt. To us, that makes the stock rather risky, like walking through a dog park with your eyes closed. But some investors may feel differently. Given the risks around Red Rock Resorts's use of debt, the sensible thing to do is to check if insiders have been unloading the stock.
At the end of the day, it's often better to focus on companies that are free from net debt. You can access our special list of such companies (all with a track record of profit growth). It's free.
We aim to bring you long-term focused research analysis driven by fundamental data. Note that our analysis may not factor in the latest price-sensitive company announcements or qualitative material.
If you spot an error that warrants correction, please contact the editor at editorial-team@simplywallst.com. This article by Simply Wall St is general in nature. It does not constitute a recommendation to buy or sell any stock, and does not take account of your objectives, or your financial situation. Simply Wall St has no position in the stocks mentioned. Thank you for reading.
About NasdaqGS:RRR
Red Rock Resorts
Through its interest in Station Casinos LLC, develops and manages casino and entertainment properties in the United States.
Undervalued with proven track record and pays a dividend.
Similar Companies
Market Insights


Advertisement
Weekly Picks
CE


Ceazar on Sparc AI ·
When GPS fails: this small cap is fixing a $54B drone problem
Fair Value:CA$5.2554.7% undervalued
109 followersusers have followed this narrative
0 commentsusers have commented on this narrative
24 likesusers have liked this narrative
BL


BlackGoat on IREN ·
IREN's Bold Moves in Sustainable Bitcoin Mining & AI Data Centers
Fair Value:US$71.4859.0% undervalued
213 followersusers have followed this narrative
8 commentsusers have commented on this narrative
32 likesusers have liked this narrative
HE


HedgeY on Arm Holdings ·
The Architecture Layer of AI Computing - But Priced Like the Future Already Arrived?
Fair Value:US$43047.7% undervalued
20 followersusers have followed this narrative
1 commentusers have commented on this narrative
6 likesusers have liked this narrative
HI


Hidden_Rock_Capital on Fiserv ·
Temporary "perfect storm" leads to opportunity to buy financial services leader for less than 5x long-term earnings
Fair Value:US$119.9953.6% undervalued
25 followersusers have followed this narrative
0 commentsusers have commented on this narrative
9 likesusers have liked this narrative
Recently Updated Narratives
TH


TheGrayWolf_80 on Schwab Strategic Trust - Schwab U.S. Dividend Equity ETF ·
Building a 75/15/10 Income Machine with Schwab's Dividend ETF
Fair Value:US$63.7546.9% undervalued
0 followersusers have followed this narrative
0 commentsusers have commented on this narrative
0 likesusers have liked this narrative
SI

simplydunno on Microsoft ·
Microsoft's Capex Bill Comes Due Before the AI Revenue Does
Fair Value:US$512.123.7% undervalued
2 followersusers have followed this narrative
0 commentsusers have commented on this narrative
0 likesusers have liked this narrative
HE

Henrynuke03 on Nigerian Exchange Group ·
Future Growth Awaits NGXGROUP with New High-Profile Listings
Fair Value:₦221.1732.3% undervalued
7 followersusers have followed this narrative
0 commentsusers have commented on this narrative
0 likesusers have liked this narrative
Popular Narratives
OS


oscargarcia on NVIDIA ·
The company that went from selling GPUs to gamers to becoming the AI arms dealer of the 21st century.
Fair Value:US$28032.1% undervalued
211 followersusers have followed this narrative
9 commentsusers have commented on this narrative
15 likesusers have liked this narrative
CU
CubanEros on Microsoft ·
A wonderful business at reasonable price.
Fair Value:US$419.917.0% undervalued
97 followersusers have followed this narrative
0 commentsusers have commented on this narrative
7 likesusers have liked this narrative
BE

benjamin_lvieq on PayPal Holdings ·
PayPal: PayPal Doesn't Need to Grow – It Needs to Stop Falling – A Mispriced Cash Machine With a Cannibal Buyback
Fair Value:US$6510.2% undervalued
74 followersusers have followed this narrative
2 commentsusers have commented on this narrative
11 likesusers have liked this narrative
Trending Discussion
BL

Blegells on Terra Balcanica Resources ·
⏫42X THE AVERAGE DAILY TRADING VOLUME TODAY, JULY 28 🐂🐂🐂 FORTY-TWO!
1
|0
DE

derek_3wsdg on Teladoc Health ·
You’ve overlooked the activist investor factor. Travis Cocke’s Voss has announced 5% ownership through a 13G filing. They’ve added to that 5% since, and in doing so, have created a structural trap door for 27.42 Million Shares actively sold short. Chuck will announce lots of positives on July 29 but it’s what Voss announces shortly after that will rock the overextended Teledoc shorts. The Walmart partnership is the tip of the iceberg. The market is missing the sheer regulatory and enterprise friction of modern corporate healthcare. Teladoc isn't a "consumer app"; it is the primary digital infrastructure integrated directly into the legacy backends of Tier-1 insurance companies and fortune 500 employers, covering 105 million+ lives. Teladoc is acting as the digital top-of-funnel engine for the world's largest retailer. If Voss pushes the narrative that Teladoc is effectively the outsourced digital brain of Walmart's entire healthcare footprint, the fair value shifts from a basic health multiple to an enterprise distribution premium. Additionally , we are in a structural gold rush for high-quality, legally compliant, longitudinal medical data to train vertical healthcare AI models. Large technology hyperscalers and pharmaceutical giants cannot simply scrape the internet for this; they need structured clinical inputs. Teladoc sits on one of the largest de-identified virtual medical datasets on earth. From the activist playbook , we’ll see Voss demand the immediate creation of a Data & Diagnostics Licensing Division, transforming a legacy liability into an incredibly high-margin, pure-software data asset that requires zero human clinician hours to scale. Chuck is doing great work and deserves credi5 for the Teledoc turnaround but it will be Travis Cocke who will be responsible for a share price way beyond your $15 valuation.
1
|0
