Advertisement
- United States
- /
- Professional Services
- /
- NasdaqGS:TTEC
How Does TTEC Holdings's (NASDAQ:TTEC) P/E Compare To Its Industry, After The Share Price Drop?
Unfortunately for some shareholders, the TTEC Holdings (NASDAQ:TTEC) share price has dived 35% in the last thirty days. Even longer term holders have taken a real hit with the stock declining 20% in the last year.
Assuming nothing else has changed, a lower share price makes a stock more attractive to potential buyers. In the long term, share prices tend to follow earnings per share, but in the short term prices bounce around in response to short term factors (which are not always obvious). The implication here is that long term investors have an opportunity when expectations of a company are too low. One way to gauge market expectations of a stock is to look at its Price to Earnings Ratio (PE Ratio). A high P/E implies that investors have high expectations of what a company can achieve compared to a company with a low P/E ratio.
View our latest analysis for TTEC Holdings
Does TTEC Holdings Have A Relatively High Or Low P/E For Its Industry?
We can tell from its P/E ratio of 17.00 that sentiment around TTEC Holdings isn't particularly high. The image below shows that TTEC Holdings has a lower P/E than the average (24.2) P/E for companies in the it industry.
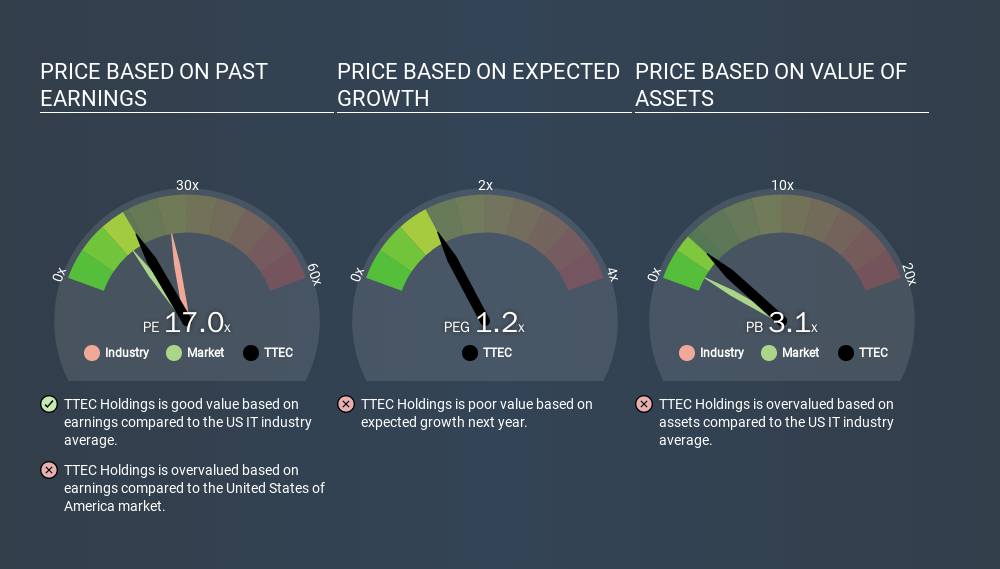
TTEC Holdings's P/E tells us that market participants think it will not fare as well as its peers in the same industry. While current expectations are low, the stock could be undervalued if the situation is better than the market assumes. It is arguably worth checking if insiders are buying shares, because that might imply they believe the stock is undervalued.
How Growth Rates Impact P/E Ratios
Probably the most important factor in determining what P/E a company trades on is the earnings growth. Earnings growth means that in the future the 'E' will be higher. That means even if the current P/E is high, it will reduce over time if the share price stays flat. So while a stock may look expensive based on past earnings, it could be cheap based on future earnings.
TTEC Holdings's earnings made like a rocket, taking off 114% last year. Even better, EPS is up 33% per year over three years. So you might say it really deserves to have an above-average P/E ratio.
Remember: P/E Ratios Don't Consider The Balance Sheet
The 'Price' in P/E reflects the market capitalization of the company. Thus, the metric does not reflect cash or debt held by the company. The exact same company would hypothetically deserve a higher P/E ratio if it had a strong balance sheet, than if it had a weak one with lots of debt, because a cashed up company can spend on growth.
Such spending might be good or bad, overall, but the key point here is that you need to look at debt to understand the P/E ratio in context.
TTEC Holdings's Balance Sheet
Net debt totals 16% of TTEC Holdings's market cap. It would probably deserve a higher P/E ratio if it was net cash, since it would have more options for growth.
The Verdict On TTEC Holdings's P/E Ratio
TTEC Holdings trades on a P/E ratio of 17.0, which is above its market average of 12.7. While the company does use modest debt, its recent earnings growth is superb. So to be frank we are not surprised it has a high P/E ratio. What can be absolutely certain is that the market has become significantly less optimistic about TTEC Holdings over the last month, with the P/E ratio falling from 26.3 back then to 17.0 today. For those who don't like to trade against momentum, that could be a warning sign, but a contrarian investor might want to take a closer look.
Investors should be looking to buy stocks that the market is wrong about. People often underestimate remarkable growth -- so investors can make money when fast growth is not fully appreciated. So this free visual report on analyst forecasts could hold the key to an excellent investment decision.
Of course, you might find a fantastic investment by looking at a few good candidates. So take a peek at this free list of companies with modest (or no) debt, trading on a P/E below 20.
If you spot an error that warrants correction, please contact the editor at editorial-team@simplywallst.com. This article by Simply Wall St is general in nature. It does not constitute a recommendation to buy or sell any stock, and does not take account of your objectives, or your financial situation. Simply Wall St has no position in the stocks mentioned.
We aim to bring you long-term focused research analysis driven by fundamental data. Note that our analysis may not factor in the latest price-sensitive company announcements or qualitative material. Thank you for reading.
About NasdaqGS:TTEC
TTEC Holdings
Operates as a customer experience (CX) company that designs, builds, and operates technology-enabled customer experiences across live interaction channels.
Undervalued with moderate growth potential.
Similar Companies
Market Insights


Advertisement
Weekly Picks
LO


Lou_Basenese on Giftify ·
Giftify ($GIFT): A Small-Cap Incentives Platform with More ScaleThan Its Valuation Suggests
Fair Value:US$2.562.2% undervalued
36 followersusers have followed this narrative
1 commentusers have commented on this narrative
8 likesusers have liked this narrative
HA


HarishPK on lululemon athletica ·
Quantifying the Transition: Why Lululemon’s Moat Remains Intact
Fair Value:US$161.828.9% undervalued
9 followersusers have followed this narrative
0 commentsusers have commented on this narrative
7 likesusers have liked this narrative
TR


tripledub on Alphabet ·
Warren Buffett Just Bet $10 Billion on Google. The Catch? You May Already Be Too Late.
Fair Value:US$23059.6% overvalued
40 followersusers have followed this narrative
1 commentusers have commented on this narrative
10 likesusers have liked this narrative
JO


John_Eric on Veeva Systems ·
AI-Powered Veeva Systems Poised for Solid Growth Amid Regulatory Stability
Fair Value:US$32039.9% undervalued
10 followersusers have followed this narrative
0 commentsusers have commented on this narrative
0 likesusers have liked this narrative
Recently Updated Narratives
DA


davidlsander on Nevgold ·
NevGold's Journey From Gold Explorer to Vital US Resource Developer
Fair Value:CA$3.127.7% undervalued
1 followerusers have followed this narrative
0 commentsusers have commented on this narrative
0 likesusers have liked this narrative
GE

Germaine on Kucingko Berhad ·
Kucingko Berhad: Fundamentals Show Early Recovery as Creative Content Expansion Gains Traction
Fair Value:RM 0.012691.7% overvalued
1 followerusers have followed this narrative
0 commentsusers have commented on this narrative
0 likesusers have liked this narrative
BL


Blagget on BP Silver ·
“valer un Potosí” GOOGLE IT. Now you’re should be kinda locked in. Educate yourself, Read the rest.
Fair Value:CA$685.7% undervalued
1 followerusers have followed this narrative
0 commentsusers have commented on this narrative
0 likesusers have liked this narrative
Popular Narratives
IN


Investingwilly on Mastercard ·
Mastercard: The Best Dividend Stock You're Ignoring
Fair Value:US$75029.1% undervalued
84 followersusers have followed this narrative
1 commentusers have commented on this narrative
9 likesusers have liked this narrative
HA

HarishPK on Adobe ·
Adobe: A Probabilistic Case for Undervaluation
Fair Value:US$319.9630.8% undervalued
64 followersusers have followed this narrative
9 commentsusers have commented on this narrative
19 likesusers have liked this narrative
BL


BlackGoat on Cerebras Systems ·
The Wafer Giant Threatening NVIDIA's GPU Hegemony
Fair Value:US$415.5457.5% undervalued
59 followersusers have followed this narrative
3 commentsusers have commented on this narrative
10 likesusers have liked this narrative
Trending Discussion


AN

andre_k1tsg on Companhia de Saneamento de Minas Gerais ·
Eu André José Julião digo o caminho da melhorar a toda população esta entrando no trilhos.
0
|0
