Advertisement
- United States
- /
- Insurance
- /
- NasdaqGS:CINF
Does Cincinnati Financial Corporation's (NASDAQ:CINF) Recent Track Record Look Strong?
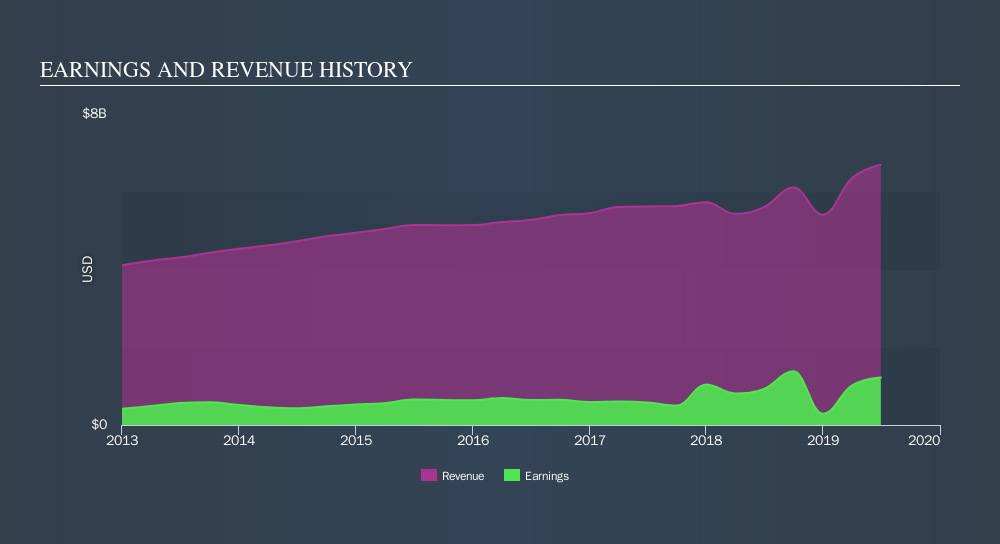
After reading Cincinnati Financial Corporation's (NasdaqGS:CINF) most recent earnings announcement (30 June 2019), I found it useful to look back at how the company has performed in the past and compare this against the latest numbers. As a long-term investor I tend to focus on earnings trend, rather than a single number at one point in time. Also, comparing it against an industry benchmark to understand whether it outperformed, or is simply riding an industry wave, is a crucial aspect. Below is a brief commentary on my key takeaways.
Check out our latest analysis for Cincinnati Financial
How Well Did CINF Perform?
CINF's trailing twelve-month earnings (from 30 June 2019) of US$1.2b has jumped 32% compared to the previous year.
Furthermore, this one-year growth rate has exceeded its 5-year annual growth average of 15%, indicating the rate at which CINF is growing has accelerated. How has it been able to do this? Let's take a look at whether it is only owing to industry tailwinds, or if Cincinnati Financial has experienced some company-specific growth.
In terms of returns from investment, Cincinnati Financial has fallen short of achieving a 20% return on equity (ROE), recording 13% instead. However, its return on assets (ROA) of 5.2% exceeds the US Insurance industry of 2.5%, indicating Cincinnati Financial has used its assets more efficiently. And finally, its return on capital (ROC), which also accounts for Cincinnati Financial’s debt level, has increased over the past 3 years from 5.3% to 6.9%. This correlates with a decrease in debt holding, with debt-to-equity ratio declining from 13% to 9.0% over the past 5 years.
What does this mean?
While past data is useful, it doesn’t tell the whole story. Positive growth and profitability are what investors like to see in a company’s track record, but how do we properly assess sustainability? I suggest you continue to research Cincinnati Financial to get a more holistic view of the stock by looking at:
- Future Outlook: What are well-informed industry analysts predicting for CINF’s future growth? Take a look at our free research report of analyst consensus for CINF’s outlook.
- Financial Health: Are CINF’s operations financially sustainable? Balance sheets can be hard to analyze, which is why we’ve done it for you. Check out our financial health checks here.
- Other High-Performing Stocks: Are there other stocks that provide better prospects with proven track records? Explore our free list of these great stocks here.
NB: Figures in this article are calculated using data from the trailing twelve months from 30 June 2019. This may not be consistent with full year annual report figures.
We aim to bring you long-term focused research analysis driven by fundamental data. Note that our analysis may not factor in the latest price-sensitive company announcements or qualitative material.
If you spot an error that warrants correction, please contact the editor at editorial-team@simplywallst.com. This article by Simply Wall St is general in nature. It does not constitute a recommendation to buy or sell any stock, and does not take account of your objectives, or your financial situation. Simply Wall St has no position in the stocks mentioned. Thank you for reading.
About NasdaqGS:CINF
Cincinnati Financial
Provides property casualty insurance products in the United States.
Solid track record with excellent balance sheet and pays a dividend.
Similar Companies
Market Insights


Advertisement
Weekly Picks
CE


Ceazar on Sparc AI ·
When GPS fails: this small cap is fixing a $54B drone problem
Fair Value:US$3.8756.1% undervalued
17 followersusers have followed this narrative
0 commentsusers have commented on this narrative
4 likesusers have liked this narrative
BL


BlackGoat on IREN ·
IREN's Bold Moves in Sustainable Bitcoin Mining & AI Data Centers
Fair Value:US$71.4859.0% undervalued
212 followersusers have followed this narrative
8 commentsusers have commented on this narrative
32 likesusers have liked this narrative
HE


HedgeY on Arm Holdings ·
The Architecture Layer of AI Computing - But Priced Like the Future Already Arrived?
Fair Value:US$43047.7% undervalued
20 followersusers have followed this narrative
1 commentusers have commented on this narrative
6 likesusers have liked this narrative
HI


Hidden_Rock_Capital on Fiserv ·
Temporary "perfect storm" leads to opportunity to buy financial services leader for less than 5x long-term earnings
Fair Value:US$119.9953.6% undervalued
25 followersusers have followed this narrative
0 commentsusers have commented on this narrative
9 likesusers have liked this narrative
Recently Updated Narratives
HE

Henrynuke03 on Nigerian Exchange Group ·
Future Growth Awaits NGXGROUP with New High-Profile Listings
Fair Value:₦221.1732.3% undervalued
7 followersusers have followed this narrative
0 commentsusers have commented on this narrative
0 likesusers have liked this narrative
PR


PrashhD on Aurionpro Solutions ·
Aurionpro Solutions: Is the Market Mispricing One of India's Most Interesting Fintech Product Companies?
Fair Value:₹1k27.1% undervalued
1 followerusers have followed this narrative
1 commentusers have commented on this narrative
0 likesusers have liked this narrative
NE

newsfinder11221 on Lotus Technology ·
Lotus Technology: A Technology-Driven Luxury EV Brand with a Promising Turnaround Story
Fair Value:US$2.464.0% undervalued
1 followerusers have followed this narrative
2 commentsusers have commented on this narrative
0 likesusers have liked this narrative
Popular Narratives
OS


oscargarcia on NVIDIA ·
The company that went from selling GPUs to gamers to becoming the AI arms dealer of the 21st century.
Fair Value:US$28032.1% undervalued
211 followersusers have followed this narrative
9 commentsusers have commented on this narrative
15 likesusers have liked this narrative
CU

CubanEros on Microsoft ·
A wonderful business at reasonable price.
Fair Value:US$419.917.0% undervalued
97 followersusers have followed this narrative
0 commentsusers have commented on this narrative
7 likesusers have liked this narrative
BE

benjamin_lvieq on PayPal Holdings ·
PayPal: PayPal Doesn't Need to Grow – It Needs to Stop Falling – A Mispriced Cash Machine With a Cannibal Buyback
Fair Value:US$6510.2% undervalued
74 followersusers have followed this narrative
2 commentsusers have commented on this narrative
11 likesusers have liked this narrative
Trending Discussion
BL

Blegells on Terra Balcanica Resources ·
⏫42X THE AVERAGE DAILY TRADING VOLUME TODAY, JULY 28 🐂🐂🐂 FORTY-TWO!
1
|0
DE

derek_3wsdg on Teladoc Health ·
You’ve overlooked the activist investor factor. Travis Cocke’s Voss has announced 5% ownership through a 13G filing. They’ve added to that 5% since, and in doing so, have created a structural trap door for 27.42 Million Shares actively sold short. Chuck will announce lots of positives on July 29 but it’s what Voss announces shortly after that will rock the overextended Teledoc shorts. The Walmart partnership is the tip of the iceberg. The market is missing the sheer regulatory and enterprise friction of modern corporate healthcare. Teladoc isn't a "consumer app"; it is the primary digital infrastructure integrated directly into the legacy backends of Tier-1 insurance companies and fortune 500 employers, covering 105 million+ lives. Teladoc is acting as the digital top-of-funnel engine for the world's largest retailer. If Voss pushes the narrative that Teladoc is effectively the outsourced digital brain of Walmart's entire healthcare footprint, the fair value shifts from a basic health multiple to an enterprise distribution premium. Additionally , we are in a structural gold rush for high-quality, legally compliant, longitudinal medical data to train vertical healthcare AI models. Large technology hyperscalers and pharmaceutical giants cannot simply scrape the internet for this; they need structured clinical inputs. Teladoc sits on one of the largest de-identified virtual medical datasets on earth. From the activist playbook , we’ll see Voss demand the immediate creation of a Data & Diagnostics Licensing Division, transforming a legacy liability into an incredibly high-margin, pure-software data asset that requires zero human clinician hours to scale. Chuck is doing great work and deserves credi5 for the Teledoc turnaround but it will be Travis Cocke who will be responsible for a share price way beyond your $15 valuation.
1
|0