

This article will reflect on the compensation paid to Paul Arenson who has served as CEO of Stenprop Limited (JSE:STP) since 2014. This analysis will also assess whether Stenprop pays its CEO appropriately, considering recent earnings growth and total shareholder returns.
Note: The company does not report funds from operations, and as a result, we have used earnings per share in our analysis.
See our latest analysis for Stenprop
How Does Total Compensation For Paul Arenson Compare With Other Companies In The Industry?
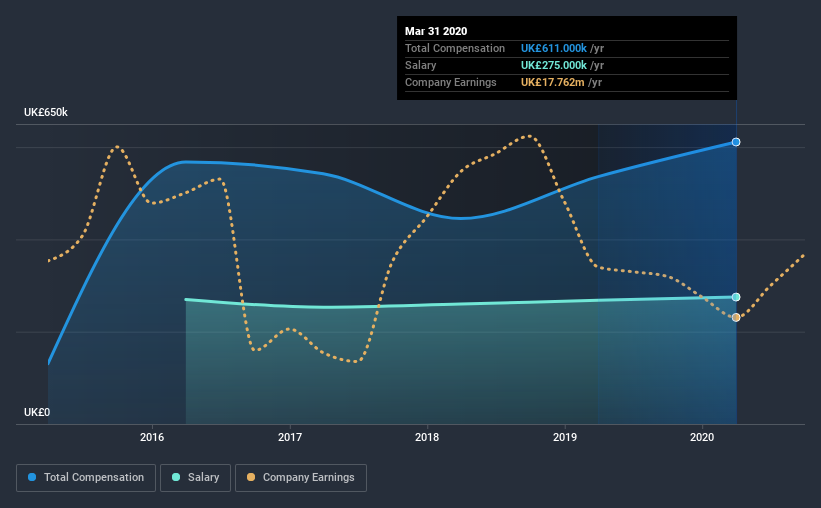
Our data indicates that Stenprop Limited has a market capitalization of R7.8b, and total annual CEO compensation was reported as UK£611k for the year to March 2020. We note that's an increase of 14% above last year. While this analysis focuses on total compensation, it's worth acknowledging that the salary portion is lower, valued at UK£275k.
On comparing similar companies from the same industry with market caps ranging from R3.0b to R12b, we found that the median CEO total compensation was UK£371k. This suggests that Paul Arenson is paid more than the median for the industry. Moreover, Paul Arenson also holds R408m worth of Stenprop stock directly under their own name, which reveals to us that they have a significant personal stake in the company.
| Component | 2020 | 2019 | Proportion (2020) |
| Salary | UK£275k | UK£268k | 45% |
| Other | UK£336k | UK£268k | 55% |
| Total Compensation | UK£611k | UK£536k | 100% |
Talking in terms of the industry, salary represented approximately 57% of total compensation out of all the companies we analyzed, while other remuneration made up 43% of the pie. It's interesting to note that Stenprop allocates a smaller portion of compensation to salary in comparison to the broader industry. If total compensation is slanted towards non-salary benefits, it indicates that CEO pay is linked to company performance.
A Look at Stenprop Limited's Growth Numbers
Stenprop Limited's earnings per share (EPS) grew 1.3% per year over the last three years. It saw its revenue drop 4.9% over the last year.
We generally like to see a little revenue growth, but it is good to see a modest EPS growth at least. In conclusion we can't form a strong opinion about business performance yet; but it's one worth watching. While we don't have analyst forecasts for the company, shareholders might want to examine this detailed historical graph of earnings, revenue and cash flow.
Has Stenprop Limited Been A Good Investment?
Boasting a total shareholder return of 87% over three years, Stenprop Limited has done well by shareholders. So they may not be at all concerned if the CEO were to be paid more than is normal for companies around the same size.
In Summary...
As we touched on above, Stenprop Limited is currently paying its CEO higher than the median pay for CEOs of companies belonging to the same industry and with similar market capitalizations. Importantly though, shareholder returns for the last three years have been excellent. That's why we were hoping EPS growth would match this growth, but sadly that is not the case. We'd ideally want to see higher EPS growth, but CEO compensation seems to be within reason, given high shareholder returns.
CEO pay is simply one of the many factors that need to be considered while examining business performance. In our study, we found 3 warning signs for Stenprop you should be aware of, and 1 of them is a bit concerning.
Of course, you might find a fantastic investment by looking at a different set of stocks. So take a peek at this free list of interesting companies.
If you decide to trade Stenprop, use the lowest-cost* platform that is rated #1 Overall by Barron’s, Interactive Brokers. Trade stocks, options, futures, forex, bonds and funds on 135 markets, all from a single integrated account. Promoted
New: AI Stock Screener & Alerts
Our new AI Stock Screener scans the market every day to uncover opportunities.
• Dividend Powerhouses (3%+ Yield)
• Undervalued Small Caps with Insider Buying
• High growth Tech and AI Companies
Or build your own from over 50 metrics.
This article by Simply Wall St is general in nature. It does not constitute a recommendation to buy or sell any stock, and does not take account of your objectives, or your financial situation. We aim to bring you long-term focused analysis driven by fundamental data. Note that our analysis may not factor in the latest price-sensitive company announcements or qualitative material. Simply Wall St has no position in any stocks mentioned.
*Interactive Brokers Rated Lowest Cost Broker by StockBrokers.com Annual Online Review 2020
Have feedback on this article? Concerned about the content? Get in touch with us directly. Alternatively, email editorial-team (at) simplywallst.com.
About JSE:MLI
Industrials REIT
Industrials REIT is a UK REIT with a primary listing on the London Stock Exchange and a secondary listing on the Johannesburg Stock Exchange.
Adequate balance sheet with moderate growth potential.
Similar Companies
Market Insights

Community Narratives


