- South Africa
- /
- Insurance
- /
- JSE:SLM
Sanlam Limited's (JSE:SLM) Business Is Trailing The Market But Its Shares Aren't


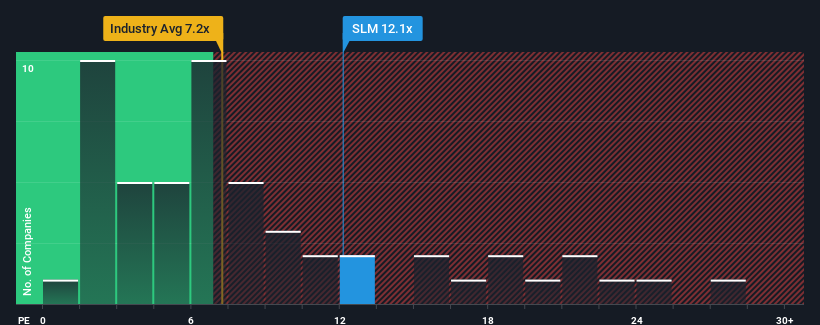
When close to half the companies in South Africa have price-to-earnings ratios (or "P/E's") below 8x, you may consider Sanlam Limited (JSE:SLM) as a stock to potentially avoid with its 12.1x P/E ratio. Although, it's not wise to just take the P/E at face value as there may be an explanation why it's as high as it is.
Recent earnings growth for Sanlam has been in line with the market. One possibility is that the P/E is high because investors think this modest earnings performance will accelerate. If not, then existing shareholders may be a little nervous about the viability of the share price.
See our latest analysis for Sanlam
How Is Sanlam's Growth Trending?
The only time you'd be truly comfortable seeing a P/E as high as Sanlam's is when the company's growth is on track to outshine the market.
Taking a look back first, we see that the company managed to grow earnings per share by a handy 2.7% last year. This was backed up an excellent period prior to see EPS up by 1,516% in total over the last three years. Accordingly, shareholders would have probably welcomed those medium-term rates of earnings growth.
Looking ahead now, EPS is anticipated to climb by 12% each year during the coming three years according to the five analysts following the company. That's shaping up to be similar to the 11% each year growth forecast for the broader market.
With this information, we find it interesting that Sanlam is trading at a high P/E compared to the market. It seems most investors are ignoring the fairly average growth expectations and are willing to pay up for exposure to the stock. These shareholders may be setting themselves up for disappointment if the P/E falls to levels more in line with the growth outlook.
The Key Takeaway
We'd say the price-to-earnings ratio's power isn't primarily as a valuation instrument but rather to gauge current investor sentiment and future expectations.
We've established that Sanlam currently trades on a higher than expected P/E since its forecast growth is only in line with the wider market. When we see an average earnings outlook with market-like growth, we suspect the share price is at risk of declining, sending the high P/E lower. Unless these conditions improve, it's challenging to accept these prices as being reasonable.
Having said that, be aware Sanlam is showing 2 warning signs in our investment analysis, you should know about.
Of course, you might find a fantastic investment by looking at a few good candidates. So take a peek at this free list of companies with a strong growth track record, trading on a low P/E.
New: Manage All Your Stock Portfolios in One Place
We've created the ultimate portfolio companion for stock investors, and it's free.
• Connect an unlimited number of Portfolios and see your total in one currency
• Be alerted to new Warning Signs or Risks via email or mobile
• Track the Fair Value of your stocks
Have feedback on this article? Concerned about the content? Get in touch with us directly. Alternatively, email editorial-team (at) simplywallst.com.
This article by Simply Wall St is general in nature. We provide commentary based on historical data and analyst forecasts only using an unbiased methodology and our articles are not intended to be financial advice. It does not constitute a recommendation to buy or sell any stock, and does not take account of your objectives, or your financial situation. We aim to bring you long-term focused analysis driven by fundamental data. Note that our analysis may not factor in the latest price-sensitive company announcements or qualitative material. Simply Wall St has no position in any stocks mentioned.
About JSE:SLM
Sanlam
Provides various financial solutions to individual, business, and institutional clients in South Africa, rest of Africa, Asia, and internationally.
Solid track record established dividend payer.
Similar Companies
Market Insights

Community Narratives
