- South Africa
- /
- Insurance
- /
- JSE:OMU
Old Mutual (JSE:OMU) shareholders have earned a 1.1% CAGR over the last five years


For many, the main point of investing is to generate higher returns than the overall market. But in any portfolio, there will be mixed results between individual stocks. At this point some shareholders may be questioning their investment in Old Mutual Limited (JSE:OMU), since the last five years saw the share price fall 32%.
Since shareholders are down over the longer term, lets look at the underlying fundamentals over the that time and see if they've been consistent with returns.
See our latest analysis for Old Mutual
To quote Buffett, 'Ships will sail around the world but the Flat Earth Society will flourish. There will continue to be wide discrepancies between price and value in the marketplace...' One flawed but reasonable way to assess how sentiment around a company has changed is to compare the earnings per share (EPS) with the share price.
While the share price declined over five years, Old Mutual actually managed to increase EPS by an average of 9.8% per year. So it doesn't seem like EPS is a great guide to understanding how the market is valuing the stock. Alternatively, growth expectations may have been unreasonable in the past.
Due to the lack of correlation between the EPS growth and the falling share price, it's worth taking a look at other metrics to try to understand the share price movement.
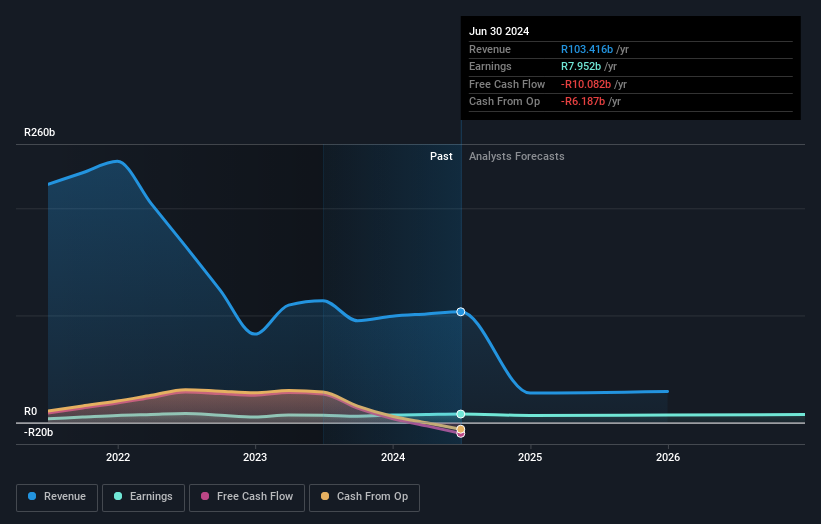
We note that the dividend has fallen in the last five years, so that may have contributed to the share price decline. On top of that, revenue has declined by 8.4% per year over the half decade; that could be a red flag for some investors.
You can see below how earnings and revenue have changed over time (discover the exact values by clicking on the image).
We know that Old Mutual has improved its bottom line over the last three years, but what does the future have in store? Take a more thorough look at Old Mutual's financial health with this free report on its balance sheet.
What About Dividends?
It is important to consider the total shareholder return, as well as the share price return, for any given stock. Whereas the share price return only reflects the change in the share price, the TSR includes the value of dividends (assuming they were reinvested) and the benefit of any discounted capital raising or spin-off. So for companies that pay a generous dividend, the TSR is often a lot higher than the share price return. In the case of Old Mutual, it has a TSR of 5.8% for the last 5 years. That exceeds its share price return that we previously mentioned. And there's no prize for guessing that the dividend payments largely explain the divergence!
A Different Perspective
Old Mutual provided a TSR of 16% over the last twelve months. But that was short of the market average. The silver lining is that the gain was actually better than the average annual return of 1.1% per year over five year. This could indicate that the company is winning over new investors, as it pursues its strategy. It's always interesting to track share price performance over the longer term. But to understand Old Mutual better, we need to consider many other factors. Even so, be aware that Old Mutual is showing 3 warning signs in our investment analysis , and 2 of those are potentially serious...
If you are like me, then you will not want to miss this free list of undervalued small caps that insiders are buying.
Please note, the market returns quoted in this article reflect the market weighted average returns of stocks that currently trade on South African exchanges.
New: AI Stock Screener & Alerts
Our new AI Stock Screener scans the market every day to uncover opportunities.
• Dividend Powerhouses (3%+ Yield)
• Undervalued Small Caps with Insider Buying
• High growth Tech and AI Companies
Or build your own from over 50 metrics.
Have feedback on this article? Concerned about the content? Get in touch with us directly. Alternatively, email editorial-team (at) simplywallst.com.
This article by Simply Wall St is general in nature. We provide commentary based on historical data and analyst forecasts only using an unbiased methodology and our articles are not intended to be financial advice. It does not constitute a recommendation to buy or sell any stock, and does not take account of your objectives, or your financial situation. We aim to bring you long-term focused analysis driven by fundamental data. Note that our analysis may not factor in the latest price-sensitive company announcements or qualitative material. Simply Wall St has no position in any stocks mentioned.
About JSE:OMU
Old Mutual
Provides financial services primarily in South Africa and rest of Africa.
Proven track record and slightly overvalued.

