- South Africa
- /
- Banks
- /
- JSE:NED
Nedbank Group's (JSE:NED) 32% CAGR outpaced the company's earnings growth over the same five-year period


When you buy a stock there is always a possibility that it could drop 100%. But on the bright side, if you buy shares in a high quality company at the right price, you can gain well over 100%. One great example is Nedbank Group Limited (JSE:NED) which saw its share price drive 193% higher over five years. In the last week the share price is up 3.6%.
The past week has proven to be lucrative for Nedbank Group investors, so let's see if fundamentals drove the company's five-year performance.
We've discovered 1 warning sign about Nedbank Group. View them for free.In his essay The Superinvestors of Graham-and-Doddsville Warren Buffett described how share prices do not always rationally reflect the value of a business. By comparing earnings per share (EPS) and share price changes over time, we can get a feel for how investor attitudes to a company have morphed over time.
Over half a decade, Nedbank Group managed to grow its earnings per share at 7.6% a year. This EPS growth is lower than the 24% average annual increase in the share price. So it's fair to assume the market has a higher opinion of the business than it did five years ago. That's not necessarily surprising considering the five-year track record of earnings growth.
The graphic below depicts how EPS has changed over time (unveil the exact values by clicking on the image).
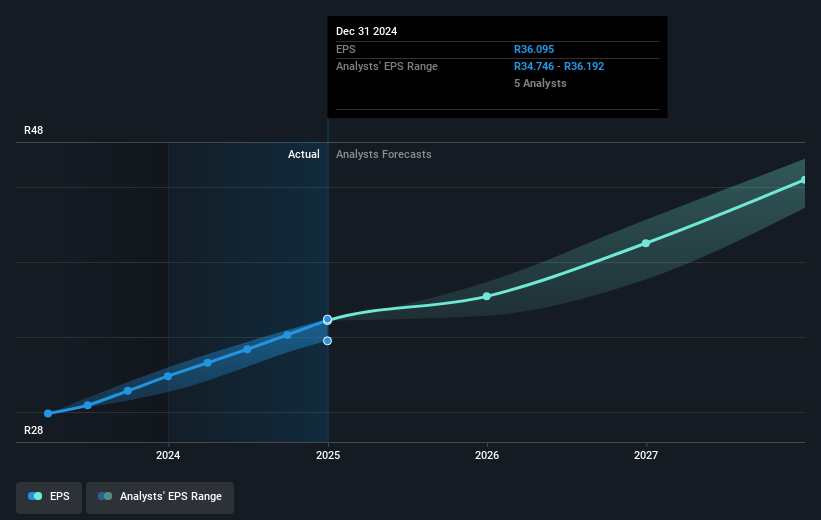
We know that Nedbank Group has improved its bottom line lately, but is it going to grow revenue? You could check out this free report showing analyst revenue forecasts.
What About Dividends?
As well as measuring the share price return, investors should also consider the total shareholder return (TSR). The TSR is a return calculation that accounts for the value of cash dividends (assuming that any dividend received was reinvested) and the calculated value of any discounted capital raisings and spin-offs. It's fair to say that the TSR gives a more complete picture for stocks that pay a dividend. As it happens, Nedbank Group's TSR for the last 5 years was 296%, which exceeds the share price return mentioned earlier. This is largely a result of its dividend payments!
A Different Perspective
Nedbank Group shareholders gained a total return of 18% during the year. But that return falls short of the market. If we look back over five years, the returns are even better, coming in at 32% per year for five years. It may well be that this is a business worth popping on the watching, given the continuing positive reception, over time, from the market. While it is well worth considering the different impacts that market conditions can have on the share price, there are other factors that are even more important. Consider risks, for instance. Every company has them, and we've spotted 1 warning sign for Nedbank Group you should know about.
If you like to buy stocks alongside management, then you might just love this free list of companies. (Hint: many of them are unnoticed AND have attractive valuation).
Please note, the market returns quoted in this article reflect the market weighted average returns of stocks that currently trade on South African exchanges.
If you're looking to trade Nedbank Group, open an account with the lowest-cost platform trusted by professionals, Interactive Brokers.
With clients in over 200 countries and territories, and access to 160 markets, IBKR lets you trade stocks, options, futures, forex, bonds and funds from a single integrated account.
Enjoy no hidden fees, no account minimums, and FX conversion rates as low as 0.03%, far better than what most brokers offer.
Sponsored ContentValuation is complex, but we're here to simplify it.
Discover if Nedbank Group might be undervalued or overvalued with our detailed analysis, featuring fair value estimates, potential risks, dividends, insider trades, and its financial condition.
Access Free AnalysisHave feedback on this article? Concerned about the content? Get in touch with us directly. Alternatively, email editorial-team (at) simplywallst.com.
This article by Simply Wall St is general in nature. We provide commentary based on historical data and analyst forecasts only using an unbiased methodology and our articles are not intended to be financial advice. It does not constitute a recommendation to buy or sell any stock, and does not take account of your objectives, or your financial situation. We aim to bring you long-term focused analysis driven by fundamental data. Note that our analysis may not factor in the latest price-sensitive company announcements or qualitative material. Simply Wall St has no position in any stocks mentioned.
About JSE:NED
Nedbank Group
Provides various wholesale and retail banking services in South Africa and internationally.
Adequate balance sheet average dividend payer.
Similar Companies
Market Insights

Community Narratives


