- United States
- /
- Electric Utilities
- /
- NasdaqGS:CEG
Constellation Energy Corporation's (NASDAQ:CEG) Shares Climb 41% But Its Business Is Yet to Catch Up


Constellation Energy Corporation (NASDAQ:CEG) shareholders have had their patience rewarded with a 41% share price jump in the last month. The last month tops off a massive increase of 130% in the last year.
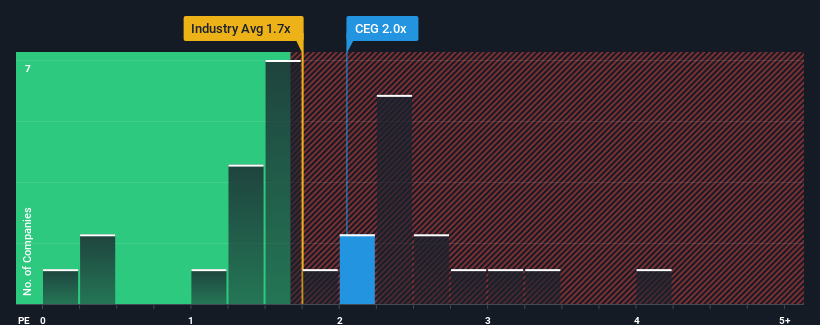
In spite of the firm bounce in price, it's still not a stretch to say that Constellation Energy's price-to-sales (or "P/S") ratio of 2x right now seems quite "middle-of-the-road" compared to the Electric Utilities industry in the United States, where the median P/S ratio is around 1.7x. Although, it's not wise to simply ignore the P/S without explanation as investors may be disregarding a distinct opportunity or a costly mistake.
View our latest analysis for Constellation Energy
What Does Constellation Energy's P/S Mean For Shareholders?
Constellation Energy certainly has been doing a good job lately as it's been growing revenue more than most other companies. It might be that many expect the strong revenue performance to wane, which has kept the P/S ratio from rising. If not, then existing shareholders have reason to be feeling optimistic about the future direction of the share price.
If you'd like to see what analysts are forecasting going forward, you should check out our free report on Constellation Energy.What Are Revenue Growth Metrics Telling Us About The P/S?
Constellation Energy's P/S ratio would be typical for a company that's only expected to deliver moderate growth, and importantly, perform in line with the industry.
Retrospectively, the last year delivered an exceptional 17% gain to the company's top line. The latest three year period has also seen an excellent 48% overall rise in revenue, aided by its short-term performance. Accordingly, shareholders would have definitely welcomed those medium-term rates of revenue growth.
Looking ahead now, revenue is anticipated to slump, contracting by 7.9% per annum during the coming three years according to the seven analysts following the company. Meanwhile, the broader industry is forecast to expand by 3.8% each year, which paints a poor picture.
With this information, we find it concerning that Constellation Energy is trading at a fairly similar P/S compared to the industry. Apparently many investors in the company reject the analyst cohort's pessimism and aren't willing to let go of their stock right now. Only the boldest would assume these prices are sustainable as these declining revenues are likely to weigh on the share price eventually.
What We Can Learn From Constellation Energy's P/S?
Its shares have lifted substantially and now Constellation Energy's P/S is back within range of the industry median. It's argued the price-to-sales ratio is an inferior measure of value within certain industries, but it can be a powerful business sentiment indicator.
While Constellation Energy's P/S isn't anything out of the ordinary for companies in the industry, we didn't expect it given forecasts of revenue decline. When we see a gloomy outlook like this, our immediate thoughts are that the share price is at risk of declining, negatively impacting P/S. If the poor revenue outlook tells us one thing, it's that these current price levels could be unsustainable.
Plus, you should also learn about these 2 warning signs we've spotted with Constellation Energy.
If companies with solid past earnings growth is up your alley, you may wish to see this free collection of other companies with strong earnings growth and low P/E ratios.
New: AI Stock Screener & Alerts
Our new AI Stock Screener scans the market every day to uncover opportunities.
• Dividend Powerhouses (3%+ Yield)
• Undervalued Small Caps with Insider Buying
• High growth Tech and AI Companies
Or build your own from over 50 metrics.
Have feedback on this article? Concerned about the content? Get in touch with us directly. Alternatively, email editorial-team (at) simplywallst.com.
This article by Simply Wall St is general in nature. We provide commentary based on historical data and analyst forecasts only using an unbiased methodology and our articles are not intended to be financial advice. It does not constitute a recommendation to buy or sell any stock, and does not take account of your objectives, or your financial situation. We aim to bring you long-term focused analysis driven by fundamental data. Note that our analysis may not factor in the latest price-sensitive company announcements or qualitative material. Simply Wall St has no position in any stocks mentioned.
About NasdaqGS:CEG
Constellation Energy
Generates and sells electricity in the United States.
Solid track record and slightly overvalued.
