
Advertisement
- United States
- /
- Transportation
- /
- NYSE:RXO
Not Many Are Piling Into RXO, Inc. (NYSE:RXO) Stock Yet As It Plummets 29%
Unfortunately for some shareholders, the RXO, Inc. (NYSE:RXO) share price has dived 29% in the last thirty days, prolonging recent pain. The drop over the last 30 days has capped off a tough year for shareholders, with the share price down 33% in that time.
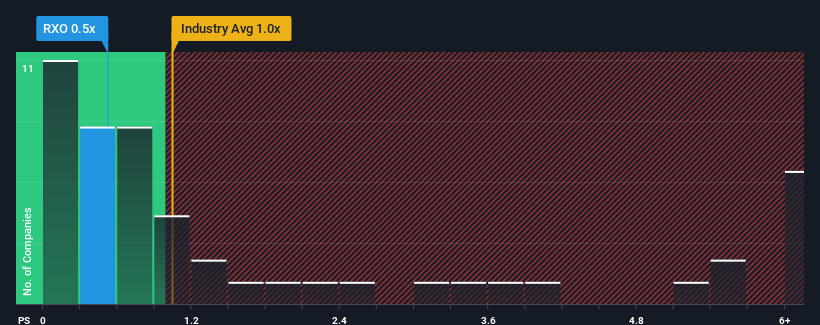
Since its price has dipped substantially, when close to half the companies operating in the United States' Transportation industry have price-to-sales ratios (or "P/S") above 1x, you may consider RXO as an enticing stock to check out with its 0.5x P/S ratio. Although, it's not wise to just take the P/S at face value as there may be an explanation why it's limited.
View our latest analysis for RXO
What Does RXO's P/S Mean For Shareholders?
With revenue growth that's superior to most other companies of late, RXO has been doing relatively well. Perhaps the market is expecting future revenue performance to dive, which has kept the P/S suppressed. If you like the company, you'd be hoping this isn't the case so that you could potentially pick up some stock while it's out of favour.
Want the full picture on analyst estimates for the company? Then our free report on RXO will help you uncover what's on the horizon.Is There Any Revenue Growth Forecasted For RXO?
There's an inherent assumption that a company should underperform the industry for P/S ratios like RXO's to be considered reasonable.
If we review the last year of revenue growth, the company posted a terrific increase of 16%. Despite this strong recent growth, it's still struggling to catch up as its three-year revenue frustratingly shrank by 3.0% overall. So unfortunately, we have to acknowledge that the company has not done a great job of growing revenues over that time.
Turning to the outlook, the next three years should generate growth of 19% each year as estimated by the analysts watching the company. Meanwhile, the rest of the industry is forecast to only expand by 8.5% each year, which is noticeably less attractive.
In light of this, it's peculiar that RXO's P/S sits below the majority of other companies. It looks like most investors are not convinced at all that the company can achieve future growth expectations.
What Does RXO's P/S Mean For Investors?
RXO's P/S has taken a dip along with its share price. Using the price-to-sales ratio alone to determine if you should sell your stock isn't sensible, however it can be a practical guide to the company's future prospects.
To us, it seems RXO currently trades on a significantly depressed P/S given its forecasted revenue growth is higher than the rest of its industry. There could be some major risk factors that are placing downward pressure on the P/S ratio. It appears the market could be anticipating revenue instability, because these conditions should normally provide a boost to the share price.
We don't want to rain on the parade too much, but we did also find 1 warning sign for RXO that you need to be mindful of.
Of course, profitable companies with a history of great earnings growth are generally safer bets. So you may wish to see this free collection of other companies that have reasonable P/E ratios and have grown earnings strongly.
New: AI Stock Screener & Alerts
Our new AI Stock Screener scans the market every day to uncover opportunities.
• Dividend Powerhouses (3%+ Yield)
• Undervalued Small Caps with Insider Buying
• High growth Tech and AI Companies
Or build your own from over 50 metrics.
Have feedback on this article? Concerned about the content? Get in touch with us directly. Alternatively, email editorial-team (at) simplywallst.com.
This article by Simply Wall St is general in nature. We provide commentary based on historical data and analyst forecasts only using an unbiased methodology and our articles are not intended to be financial advice. It does not constitute a recommendation to buy or sell any stock, and does not take account of your objectives, or your financial situation. We aim to bring you long-term focused analysis driven by fundamental data. Note that our analysis may not factor in the latest price-sensitive company announcements or qualitative material. Simply Wall St has no position in any stocks mentioned.
About NYSE:RXO
RXO
Engages in truck brokerage business in the United States, Canada, Mexico, Asia, and Europe.
Undervalued with moderate growth potential.
Market Insights

Advertisement
Community Narratives
Finding The True Value Of A Logistics Powerhouse
Fair Value US$95.21|8.4% undervalued
NV
Community Contributor
Paradigm Biopharmaceuticals Will Lead Osteoarthritis Treatment with Zilosul's FDA Success
Fair Value AU$5.50|92.1% undervalued
AM
Community Contributor
Barrick Mining (ABX:CA): A Gold Hedge against a U.S. Shutdown
Fair Value CA$60.00|24.2% undervalued
GM
Community Contributor