- United States
- /
- Logistics
- /
- NasdaqGS:CHRW
Here's What To Make Of C.H. Robinson Worldwide's (NASDAQ:CHRW) Decelerating Rates Of Return


There are a few key trends to look for if we want to identify the next multi-bagger. One common approach is to try and find a company with returns on capital employed (ROCE) that are increasing, in conjunction with a growing amount of capital employed. Put simply, these types of businesses are compounding machines, meaning they are continually reinvesting their earnings at ever-higher rates of return. So while C.H. Robinson Worldwide (NASDAQ:CHRW) has a high ROCE right now, lets see what we can decipher from how returns are changing.
Understanding Return On Capital Employed (ROCE)
If you haven't worked with ROCE before, it measures the 'return' (pre-tax profit) a company generates from capital employed in its business. Analysts use this formula to calculate it for C.H. Robinson Worldwide:
Return on Capital Employed = Earnings Before Interest and Tax (EBIT) ÷ (Total Assets - Current Liabilities)
0.23 = US$626m ÷ (US$5.3b - US$2.6b) (Based on the trailing twelve months to September 2023).
Therefore, C.H. Robinson Worldwide has an ROCE of 23%. That's a fantastic return and not only that, it outpaces the average of 12% earned by companies in a similar industry.
See our latest analysis for C.H. Robinson Worldwide
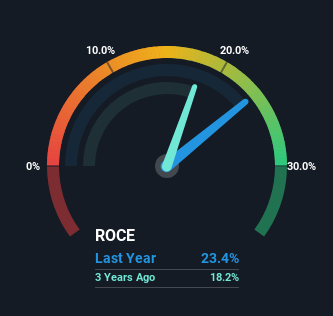
Above you can see how the current ROCE for C.H. Robinson Worldwide compares to its prior returns on capital, but there's only so much you can tell from the past. If you're interested, you can view the analysts predictions in our free report on analyst forecasts for the company.
What Does the ROCE Trend For C.H. Robinson Worldwide Tell Us?
Over the past five years, C.H. Robinson Worldwide's ROCE and capital employed have both remained mostly flat. This tells us the company isn't reinvesting in itself, so it's plausible that it's past the growth phase. Although current returns are high, we'd need more evidence of underlying growth for it to look like a multi-bagger going forward. This probably explains why C.H. Robinson Worldwide is paying out 56% of its income to shareholders in the form of dividends. Unless businesses have highly compelling growth opportunities, they'll typically return some money to shareholders.
On another note, while the change in ROCE trend might not scream for attention, it's interesting that the current liabilities have actually gone up over the last five years. This is intriguing because if current liabilities hadn't increased to 50% of total assets, this reported ROCE would probably be less than23% because total capital employed would be higher.The 23% ROCE could be even lower if current liabilities weren't 50% of total assets, because the the formula would show a larger base of total capital employed. Additionally, this high level of current liabilities isn't ideal because it means the company's suppliers (or short-term creditors) are effectively funding a large portion of the business.
In Conclusion...
Although is allocating it's capital efficiently to generate impressive returns, it isn't compounding its base of capital, which is what we'd see from a multi-bagger. And investors may be recognizing these trends since the stock has only returned a total of 16% to shareholders over the last five years. So if you're looking for a multi-bagger, the underlying trends indicate you may have better chances elsewhere.
On a final note, we've found 2 warning signs for C.H. Robinson Worldwide that we think you should be aware of.
If you'd like to see other companies earning high returns, check out our free list of companies earning high returns with solid balance sheets here.
New: AI Stock Screener & Alerts
Our new AI Stock Screener scans the market every day to uncover opportunities.
• Dividend Powerhouses (3%+ Yield)
• Undervalued Small Caps with Insider Buying
• High growth Tech and AI Companies
Or build your own from over 50 metrics.
Have feedback on this article? Concerned about the content? Get in touch with us directly. Alternatively, email editorial-team (at) simplywallst.com.
This article by Simply Wall St is general in nature. We provide commentary based on historical data and analyst forecasts only using an unbiased methodology and our articles are not intended to be financial advice. It does not constitute a recommendation to buy or sell any stock, and does not take account of your objectives, or your financial situation. We aim to bring you long-term focused analysis driven by fundamental data. Note that our analysis may not factor in the latest price-sensitive company announcements or qualitative material. Simply Wall St has no position in any stocks mentioned.
About NasdaqGS:CHRW
C.H. Robinson Worldwide
Provides freight transportation services, and related logistics and supply chain services in the United States and internationally.
Average dividend payer with moderate growth potential.

