Advertisement
- United States
- /
- Telecom Services and Carriers
- /
- NasdaqGS:CMCSA
Is Comcast (CMCSA) Offering Value After Recent Share Price Weakness And Broadband Concerns

Reviewed by Bailey Pemberton
- If you are looking at Comcast and wondering whether the current share price offers good value, you are not alone. The stock has drawn fresh attention as investors reassess what a fair price looks like.
- Comcast recently closed at US$28.42, with returns of 1.9% over the last 7 days and 0.7% over the last 30 days. The year to date return of a 3.8% decline and 1 year return of a 13.5% decline contrast with a 12.5% decline over 3 years and a 28.1% decline over 5 years.
- Recent headlines around Comcast have focused on its position in broadband and media, including ongoing commentary about competition in streaming and the stability of its cable subscriber base. This context has helped frame how investors interpret the recent share price moves and assess whether the current level reflects opportunity or ongoing concerns.
- Our valuation checks give Comcast a score of 5 out of 6. This suggests there is more to unpack as we compare different valuation approaches, and we will also look at an even more comprehensive way to think about value at the end of this article.
Find out why Comcast's -13.5% return over the last year is lagging behind its peers.
Approach 1: Comcast Discounted Cash Flow (DCF) Analysis
A Discounted Cash Flow, or DCF, model estimates what a company might be worth by projecting its future cash flows and discounting them back to today, so you can compare that value to the current share price.
For Comcast, the model uses a 2 Stage Free Cash Flow to Equity approach. The latest twelve month free cash flow sits at about US$17.6b. Analyst estimates and extrapolations point to free cash flow of US$17.1b in 2028, with a series of annual projections running out to 2035 that are discounted back to today using Simply Wall St’s assumptions.
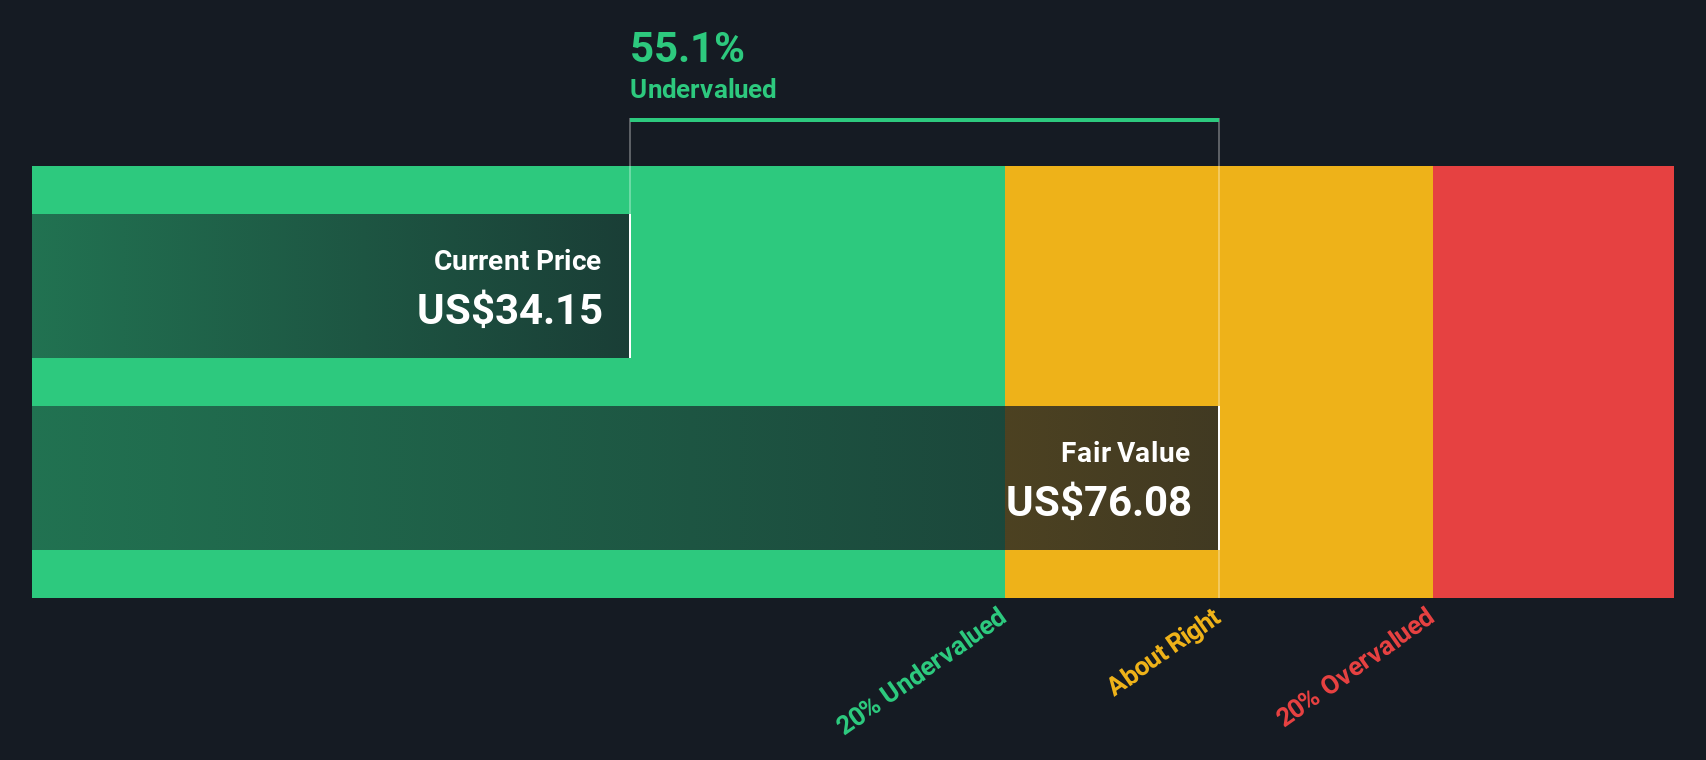
When all those future cash flows are added together and discounted, the model arrives at an estimated intrinsic value of US$94.64 per share. Against the recent share price of US$28.42, this implies the stock screens as around 70.0% undervalued on this DCF view.
Result: UNDERVALUED
Our Discounted Cash Flow (DCF) analysis suggests Comcast is undervalued by 70.0%. Track this in your watchlist or portfolio, or discover 884 more undervalued stocks based on cash flows.
Approach 2: Comcast Price vs Earnings
P/E is a common way to value profitable companies because it links what you pay for each share directly to the earnings that support it. In general, higher growth expectations and lower perceived risk can justify a higher P/E, while lower growth or higher risk usually point to a lower, more conservative P/E as “normal” for a stock.
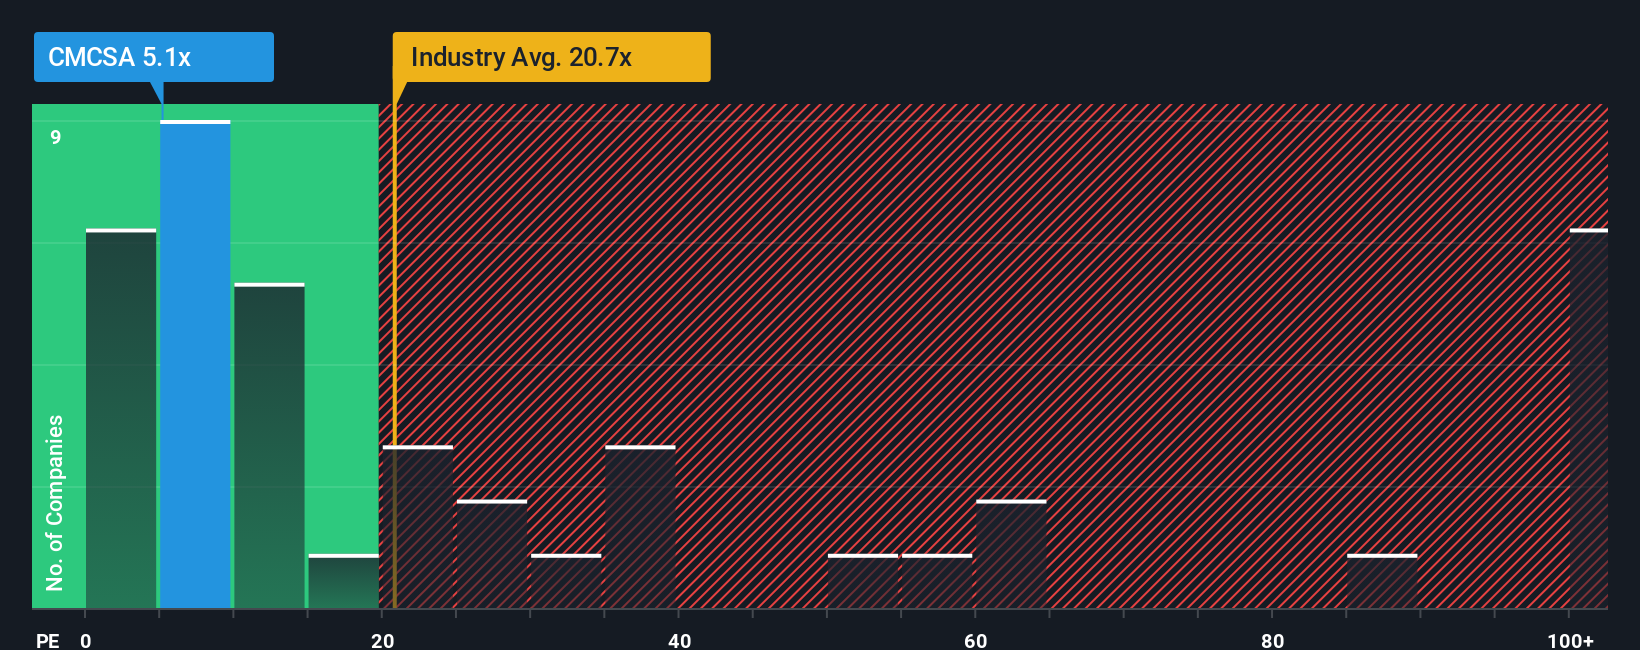
Comcast currently trades on a P/E of 4.58x. That sits below the Telecom industry average P/E of 16.53x and also below the peer average of 10.15x. On those simple comparisons, the shares look inexpensive relative to both the broader industry and closer peers.
Simply Wall St’s Fair Ratio estimate for Comcast is 9.29x. This is a proprietary view of what Comcast’s P/E might be given factors such as its earnings growth profile, profit margins, industry, market cap and company specific risks. Because it blends these fundamentals, the Fair Ratio can be more tailored than a plain peer or industry comparison, which may not account for differences in risk or quality.
Comparing the Fair Ratio of 9.29x with the current P/E of 4.58x, the shares screen as undervalued on this preferred multiple view.
Result: UNDERVALUED
P/E ratios tell one story, but what if the real opportunity lies elsewhere? Discover 1440 companies where insiders are betting big on explosive growth.
Upgrade Your Decision Making: Choose your Comcast Narrative
Earlier we mentioned that there is an even better way to understand valuation. On Simply Wall St's Community page you can use Narratives, where you set a story for Comcast, tie that story to your own revenue, earnings and margin assumptions, translate those into a Fair Value, and then compare that Fair Value with the current share price. The platform updates your Narrative as new news or earnings arrive. For Comcast you might lean toward a higher Fair Value near US$49.43 if you think bundled broadband, streaming and parks can support stronger long term economics, or closer to US$28.00 if you think broadband headwinds and rising media costs matter more. You can then use that gap between Fair Value and price to help decide whether the stock looks attractive, fairly priced or expensive to you.
For Comcast, however, we will make it really easy for you with previews of two leading Comcast Narratives:
Fair value: US$33.93 per share
Gap to fair value: around 16.2% above the recent US$28.42 share price
Revenue growth assumption: about 1.15% a year
- Broadband upgrades, streaming scale at Peacock, and new theme parks like Epic Universe are framed as key supports for revenue and margin durability.
- Analysts in this camp tie their view to a consensus price target of US$39.75, built on earnings of US$13.9b by 2028 and a future P/E of 12.0x.
- They also factor in U.S. tax changes and ongoing share buybacks as supporting free cash flow and returns, while still highlighting broadband and media cost risks.
Fair value: US$28.00 per share
Gap to fair value: around 1.5% below the recent US$28.42 share price
Revenue growth assumption: about 0.69% a year
- This view focuses on broadband saturation, cord cutting, higher sports rights costs and heavy capital spending as headwinds for earnings and free cash flow.
- Bearish analysts anchor on a lower price target of US$31.00, built on earnings of US$11.2b by 2028 and a future P/E of 11.6x.
- They see the Warner Bros. Discovery bidding, NBA media deal and other media moves as adding uncertainty to margins and valuation until returns become clearer.
Put simply, one narrative says Comcast is trading at a discount to what its cash generation and earnings power could justify, while the other argues the current price already reflects, or even runs ahead of, a tougher broadband and media outlook. Where you land between those two will come down to how confident you are in Comcast's ability to execute on broadband, streaming, and media deals over the next few years, and what you think is a reasonable P/E for that earnings path.
Curious how numbers become stories that shape markets? Explore Community Narratives
Do you think there's more to the story for Comcast? Head over to our Community to see what others are saying!

This article by Simply Wall St is general in nature. We provide commentary based on historical data and analyst forecasts only using an unbiased methodology and our articles are not intended to be financial advice. It does not constitute a recommendation to buy or sell any stock, and does not take account of your objectives, or your financial situation. We aim to bring you long-term focused analysis driven by fundamental data. Note that our analysis may not factor in the latest price-sensitive company announcements or qualitative material. Simply Wall St has no position in any stocks mentioned.
New: AI Stock Screener & Alerts
Our new AI Stock Screener scans the market every day to uncover opportunities.
• Dividend Powerhouses (3%+ Yield)
• Undervalued Small Caps with Insider Buying
• High growth Tech and AI Companies
Or build your own from over 50 metrics.
Have feedback on this article? Concerned about the content? Get in touch with us directly. Alternatively, email editorial-team@simplywallst.com
About NasdaqGS:CMCSA
Comcast
Operates as a media and technology company worldwide.
6 star dividend payer and undervalued.
Similar Companies
Market Insights


Advertisement
Weekly Picks
DA


davidlsander on Nevgold ·
The U.S. Government Is Desperate for This Metal. This Tiny Miner Has It -- Its Closest Peer Is Already Worth Double.
Fair Value:US$2.1944.7% undervalued
23 followersusers have followed this narrative
0 commentsusers have commented on this narrative
2 likesusers have liked this narrative
BE

benjamin_lvieq on PayPal Holdings ·
PayPal: PayPal Doesn't Need to Grow – It Needs to Stop Falling – A Mispriced Cash Machine With a Cannibal Buyback
Fair Value:US$6512.7% undervalued
55 followersusers have followed this narrative
2 commentsusers have commented on this narrative
9 likesusers have liked this narrative
JD

JD009 on Celsius Holdings ·
From $5M to $2B: Why the 2024 Crash Was the Best Buying Opportunity in Consumer Stocks
Fair Value:US$55.4345.9% undervalued
18 followersusers have followed this narrative
1 commentusers have commented on this narrative
8 likesusers have liked this narrative
WA

Wavefarer on Accenture ·
High-quality global services company facing an AI-driven valuation reset.
Fair Value:US$30152.0% undervalued
16 followersusers have followed this narrative
0 commentsusers have commented on this narrative
4 likesusers have liked this narrative
Recently Updated Narratives
CH

chris_packerfan on Micron Technology ·
Expect Micron Technology's Valuation to Hit 1890.54 Next Year
Fair Value:US$1.89k54.9% undervalued
0 followersusers have followed this narrative
0 commentsusers have commented on this narrative
0 likesusers have liked this narrative
ES

Esteban on Hershey ·
Hershey - fortress brand-and-scale position in U.S. confectionery: protects the downside far better than it compounds the upside
Fair Value:US$79.25120.5% overvalued
3 followersusers have followed this narrative
0 commentsusers have commented on this narrative
0 likesusers have liked this narrative
RO


RockeTeller on Silver One Resources ·
Silver One Resources, US$0.96/oz for 137Moz AgEq Past-Producing Silver Project, Eric Sprott Owns 15.61%
Fair Value:CA$2.585.6% undervalued
1 followerusers have followed this narrative
0 commentsusers have commented on this narrative
0 likesusers have liked this narrative
Popular Narratives
IN


Investingwilly on Mastercard ·
Mastercard: The Best Dividend Stock You're Ignoring
Fair Value:US$75026.5% undervalued
93 followersusers have followed this narrative
1 commentusers have commented on this narrative
9 likesusers have liked this narrative
BL


BlackGoat on Cerebras Systems ·
The Wafer Giant Threatening NVIDIA's GPU Hegemony
Fair Value:US$415.5456.6% undervalued
63 followersusers have followed this narrative
3 commentsusers have commented on this narrative
11 likesusers have liked this narrative
CE


Ceazar on Conexeu Sciences ·
This small biotech is developing technology that could potentially change how tissue is rebuilt
Fair Value:US$25.3458.5% undervalued
60 followersusers have followed this narrative
0 commentsusers have commented on this narrative
9 likesusers have liked this narrative
Trending Discussion
ST


StoxEurope on Koninklijke Ahold Delhaize ·
I ran Ahold Delhaize through a three-model triangulation — DCF, dividend discount, and residual inco...
1
|0
BE
benjamin_lvieq on PayPal Holdings ·
An investment case is not about loving the product. Its about price vs reality.
1
|0