- United States
- /
- Communications
- /
- NYSE:MSI
A Look At The Intrinsic Value Of Motorola Solutions, Inc. (NYSE:MSI)


Key Insights
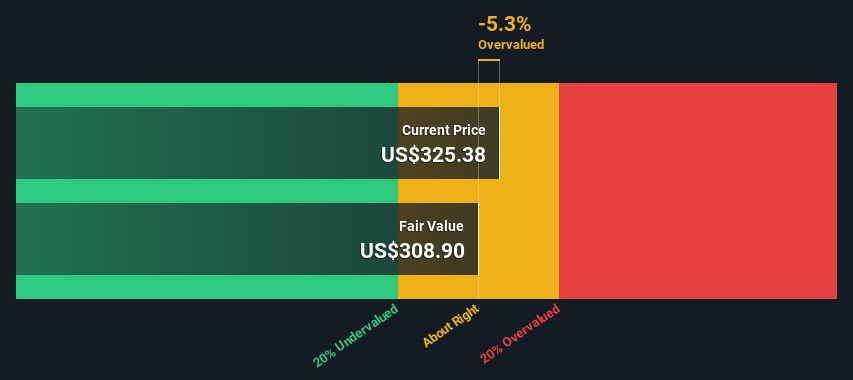
- The projected fair value for Motorola Solutions is US$309 based on 2 Stage Free Cash Flow to Equity
- Motorola Solutions' US$325 share price indicates it is trading at similar levels as its fair value estimate
- The US$328 analyst price target for MSI is 6.2% more than our estimate of fair value
Today we will run through one way of estimating the intrinsic value of Motorola Solutions, Inc. (NYSE:MSI) by estimating the company's future cash flows and discounting them to their present value. This will be done using the Discounted Cash Flow (DCF) model. There's really not all that much to it, even though it might appear quite complex.
We would caution that there are many ways of valuing a company and, like the DCF, each technique has advantages and disadvantages in certain scenarios. If you still have some burning questions about this type of valuation, take a look at the Simply Wall St analysis model.
See our latest analysis for Motorola Solutions
The Method
We use what is known as a 2-stage model, which simply means we have two different periods of growth rates for the company's cash flows. Generally the first stage is higher growth, and the second stage is a lower growth phase. To start off with, we need to estimate the next ten years of cash flows. Where possible we use analyst estimates, but when these aren't available we extrapolate the previous free cash flow (FCF) from the last estimate or reported value. We assume companies with shrinking free cash flow will slow their rate of shrinkage, and that companies with growing free cash flow will see their growth rate slow, over this period. We do this to reflect that growth tends to slow more in the early years than it does in later years.
Generally we assume that a dollar today is more valuable than a dollar in the future, and so the sum of these future cash flows is then discounted to today's value:
10-year free cash flow (FCF) forecast
| 2024 | 2025 | 2026 | 2027 | 2028 | 2029 | 2030 | 2031 | 2032 | 2033 | |
| Levered FCF ($, Millions) | US$1.93b | US$2.16b | US$2.43b | US$2.62b | US$2.77b | US$2.90b | US$3.02b | US$3.12b | US$3.21b | US$3.30b |
| Growth Rate Estimate Source | Analyst x5 | Analyst x4 | Analyst x1 | Analyst x1 | Est @ 5.69% | Est @ 4.65% | Est @ 3.92% | Est @ 3.41% | Est @ 3.05% | Est @ 2.80% |
| Present Value ($, Millions) Discounted @ 7.3% | US$1.8k | US$1.9k | US$2.0k | US$2.0k | US$1.9k | US$1.9k | US$1.8k | US$1.8k | US$1.7k | US$1.6k |
("Est" = FCF growth rate estimated by Simply Wall St)
Present Value of 10-year Cash Flow (PVCF) = US$18b
After calculating the present value of future cash flows in the initial 10-year period, we need to calculate the Terminal Value, which accounts for all future cash flows beyond the first stage. For a number of reasons a very conservative growth rate is used that cannot exceed that of a country's GDP growth. In this case we have used the 5-year average of the 10-year government bond yield (2.2%) to estimate future growth. In the same way as with the 10-year 'growth' period, we discount future cash flows to today's value, using a cost of equity of 7.3%.
Terminal Value (TV)= FCF2033 × (1 + g) ÷ (r – g) = US$3.3b× (1 + 2.2%) ÷ (7.3%– 2.2%) = US$66b
Present Value of Terminal Value (PVTV)= TV / (1 + r)10= US$66b÷ ( 1 + 7.3%)10= US$33b
The total value, or equity value, is then the sum of the present value of the future cash flows, which in this case is US$51b. To get the intrinsic value per share, we divide this by the total number of shares outstanding. Compared to the current share price of US$325, the company appears around fair value at the time of writing. The assumptions in any calculation have a big impact on the valuation, so it is better to view this as a rough estimate, not precise down to the last cent.
The Assumptions
Now the most important inputs to a discounted cash flow are the discount rate, and of course, the actual cash flows. Part of investing is coming up with your own evaluation of a company's future performance, so try the calculation yourself and check your own assumptions. The DCF also does not consider the possible cyclicality of an industry, or a company's future capital requirements, so it does not give a full picture of a company's potential performance. Given that we are looking at Motorola Solutions as potential shareholders, the cost of equity is used as the discount rate, rather than the cost of capital (or weighted average cost of capital, WACC) which accounts for debt. In this calculation we've used 7.3%, which is based on a levered beta of 1.016. Beta is a measure of a stock's volatility, compared to the market as a whole. We get our beta from the industry average beta of globally comparable companies, with an imposed limit between 0.8 and 2.0, which is a reasonable range for a stable business.
SWOT Analysis for Motorola Solutions
- Earnings growth over the past year exceeded the industry.
- Debt is well covered by earnings and cashflows.
- Dividends are covered by earnings and cash flows.
- Dividend is low compared to the top 25% of dividend payers in the Communications market.
- Expensive based on P/E ratio and estimated fair value.
- Annual earnings are forecast to grow for the next 4 years.
- Annual earnings are forecast to grow slower than the American market.
Looking Ahead:
Whilst important, the DCF calculation ideally won't be the sole piece of analysis you scrutinize for a company. The DCF model is not a perfect stock valuation tool. Rather it should be seen as a guide to "what assumptions need to be true for this stock to be under/overvalued?" For example, changes in the company's cost of equity or the risk free rate can significantly impact the valuation. For Motorola Solutions, we've put together three further factors you should further examine:
- Risks: To that end, you should be aware of the 2 warning signs we've spotted with Motorola Solutions .
- Management:Have insiders been ramping up their shares to take advantage of the market's sentiment for MSI's future outlook? Check out our management and board analysis with insights on CEO compensation and governance factors.
- Other High Quality Alternatives: Do you like a good all-rounder? Explore our interactive list of high quality stocks to get an idea of what else is out there you may be missing!
PS. Simply Wall St updates its DCF calculation for every American stock every day, so if you want to find the intrinsic value of any other stock just search here.
New: Manage All Your Stock Portfolios in One Place
We've created the ultimate portfolio companion for stock investors, and it's free.
• Connect an unlimited number of Portfolios and see your total in one currency
• Be alerted to new Warning Signs or Risks via email or mobile
• Track the Fair Value of your stocks
Have feedback on this article? Concerned about the content? Get in touch with us directly. Alternatively, email editorial-team (at) simplywallst.com.
This article by Simply Wall St is general in nature. We provide commentary based on historical data and analyst forecasts only using an unbiased methodology and our articles are not intended to be financial advice. It does not constitute a recommendation to buy or sell any stock, and does not take account of your objectives, or your financial situation. We aim to bring you long-term focused analysis driven by fundamental data. Note that our analysis may not factor in the latest price-sensitive company announcements or qualitative material. Simply Wall St has no position in any stocks mentioned.
About NYSE:MSI
Motorola Solutions
Provides public safety and enterprise security solutions in the United States, the United Kingdom, Canada, and internationally.
Reasonable growth potential with adequate balance sheet and pays a dividend.
Similar Companies
Market Insights

Community Narratives
