Advertisement
- United States
- /
- Communications
- /
- NasdaqGM:OCC
Optical Cable (NASDAQ:OCC) Is Making Moderate Use Of Debt
David Iben put it well when he said, 'Volatility is not a risk we care about. What we care about is avoiding the permanent loss of capital.' So it seems the smart money knows that debt - which is usually involved in bankruptcies - is a very important factor, when you assess how risky a company is. As with many other companies Optical Cable Corporation (NASDAQ:OCC) makes use of debt. But the real question is whether this debt is making the company risky.
Why Does Debt Bring Risk?
Generally speaking, debt only becomes a real problem when a company can't easily pay it off, either by raising capital or with its own cash flow. In the worst case scenario, a company can go bankrupt if it cannot pay its creditors. However, a more usual (but still expensive) situation is where a company must dilute shareholders at a cheap share price simply to get debt under control. Of course, debt can be an important tool in businesses, particularly capital heavy businesses. The first step when considering a company's debt levels is to consider its cash and debt together.
See our latest analysis for Optical Cable
What Is Optical Cable's Debt?
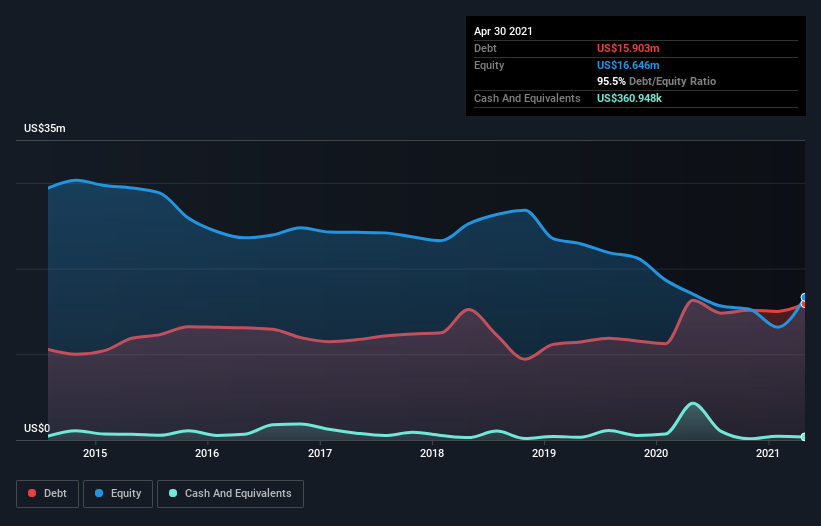
The chart below, which you can click on for greater detail, shows that Optical Cable had US$15.9m in debt in April 2021; about the same as the year before. However, it also had US$360.9k in cash, and so its net debt is US$15.5m.
How Healthy Is Optical Cable's Balance Sheet?
We can see from the most recent balance sheet that Optical Cable had liabilities of US$11.5m falling due within a year, and liabilities of US$12.3m due beyond that. Offsetting this, it had US$360.9k in cash and US$12.1m in receivables that were due within 12 months. So its liabilities outweigh the sum of its cash and (near-term) receivables by US$11.4m.
Optical Cable has a market capitalization of US$31.8m, so it could very likely raise cash to ameliorate its balance sheet, if the need arose. But it's clear that we should definitely closely examine whether it can manage its debt without dilution. There's no doubt that we learn most about debt from the balance sheet. But it is Optical Cable's earnings that will influence how the balance sheet holds up in the future. So when considering debt, it's definitely worth looking at the earnings trend. Click here for an interactive snapshot.
In the last year Optical Cable had a loss before interest and tax, and actually shrunk its revenue by 13%, to US$55m. That's not what we would hope to see.
Caveat Emptor
Not only did Optical Cable's revenue slip over the last twelve months, but it also produced negative earnings before interest and tax (EBIT). Its EBIT loss was a whopping US$3.3m. Considering that alongside the liabilities mentioned above does not give us much confidence that company should be using so much debt. So we think its balance sheet is a little strained, though not beyond repair. Another cause for caution is that is bled US$3.3m in negative free cash flow over the last twelve months. So suffice it to say we consider the stock very risky. The balance sheet is clearly the area to focus on when you are analysing debt. But ultimately, every company can contain risks that exist outside of the balance sheet. We've identified 3 warning signs with Optical Cable (at least 2 which are potentially serious) , and understanding them should be part of your investment process.
If you're interested in investing in businesses that can grow profits without the burden of debt, then check out this free list of growing businesses that have net cash on the balance sheet.
When trading Optical Cable or any other investment, use the platform considered by many to be the Professional's Gateway to the Worlds Market, Interactive Brokers. You get the lowest-cost* trading on stocks, options, futures, forex, bonds and funds worldwide from a single integrated account. Promoted
New: AI Stock Screener & Alerts
Our new AI Stock Screener scans the market every day to uncover opportunities.
• Dividend Powerhouses (3%+ Yield)
• Undervalued Small Caps with Insider Buying
• High growth Tech and AI Companies
Or build your own from over 50 metrics.
This article by Simply Wall St is general in nature. It does not constitute a recommendation to buy or sell any stock, and does not take account of your objectives, or your financial situation. We aim to bring you long-term focused analysis driven by fundamental data. Note that our analysis may not factor in the latest price-sensitive company announcements or qualitative material. Simply Wall St has no position in any stocks mentioned.
*Interactive Brokers Rated Lowest Cost Broker by StockBrokers.com Annual Online Review 2020
Have feedback on this article? Concerned about the content? Get in touch with us directly. Alternatively, email editorial-team (at) simplywallst.com.
About NasdaqGM:OCC
Optical Cable
Manufactures and sells fiber optic and copper data communications cabling and connectivity solutions primarily for the enterprise market in the United States and internationally.
Acceptable track record with mediocre balance sheet.
Similar Companies
Market Insights


Advertisement
Weekly Picks
CE


Ceazar on Sparc AI ·
When GPS fails: this small cap is fixing a $54B drone problem
Fair Value:CA$5.2552.0% undervalued
132 followersusers have followed this narrative
0 commentsusers have commented on this narrative
25 likesusers have liked this narrative
BL


BlackGoat on IREN ·
IREN's Bold Moves in Sustainable Bitcoin Mining & AI Data Centers
Fair Value:US$71.4848.5% undervalued
227 followersusers have followed this narrative
10 commentsusers have commented on this narrative
33 likesusers have liked this narrative
HE


HedgeY on Arm Holdings ·
The Architecture Layer of AI Computing - But Priced Like the Future Already Arrived?
Fair Value:US$43044.3% undervalued
27 followersusers have followed this narrative
1 commentusers have commented on this narrative
8 likesusers have liked this narrative
HI


Hidden_Rock_Capital on Fiserv ·
Temporary "perfect storm" leads to opportunity to buy financial services leader for less than 5x long-term earnings
Fair Value:US$119.9955.0% undervalued
37 followersusers have followed this narrative
1 commentusers have commented on this narrative
11 likesusers have liked this narrative
Recently Updated Narratives
TR


tripledub on Alphabet ·
Warren Buffett Just Bet $10 Billion on Google. The Catch? You May Already Be Too Late.
Fair Value:US$202.6275.8% overvalued
125 followersusers have followed this narrative
1 commentusers have commented on this narrative
0 likesusers have liked this narrative
CH

ChuckN on XPLR Infrastructure ·
Investor Thesis: Why XPLR Infrastructure Could Be Deeply Undervalued in an AI Power Cycle
Fair Value:US$209.0294.3% undervalued
5 followersusers have followed this narrative
0 commentsusers have commented on this narrative
0 likesusers have liked this narrative
AN


andre_santos on Netflix ·
Netflix - A Fundamental Valuation
Fair Value:US$98.7127.4% undervalued
11 followersusers have followed this narrative
0 commentsusers have commented on this narrative
0 likesusers have liked this narrative
Popular Narratives
OS


oscargarcia on NVIDIA ·
The company that went from selling GPUs to gamers to becoming the AI arms dealer of the 21st century.
Fair Value:US$28028.3% undervalued
233 followersusers have followed this narrative
9 commentsusers have commented on this narrative
15 likesusers have liked this narrative
CU

CubanEros on Microsoft ·
A wonderful business at reasonable price.
Fair Value:US$419.9110.7% overvalued
110 followersusers have followed this narrative
0 commentsusers have commented on this narrative
7 likesusers have liked this narrative
TR
tripledub on Alphabet ·
Warren Buffett Just Bet $10 Billion on Google. The Catch? You May Already Be Too Late.
Fair Value:US$202.6275.8% overvalued
125 followersusers have followed this narrative
1 commentusers have commented on this narrative
18 likesusers have liked this narrative
Trending Discussion
GR
greg_xasak on Fiserv ·
As someone who has dealt directly with them as a CTO for a credit union, I have 8 years of horror stories about doing business with them. If there was any other competitor than could deliver 80% of Fiserv services, there would be a mad rush to migrate to them. They should thank their lucky stars they are a near monopoly. this industry is so ripe for a well funded competitor. Their integration of technology is awful, their ability to fix their own implementation screwups is sadly tragic. Sometimes they just silently kill support tickets without resolution and you never find out until you do a follow up inquiry. Why, because sometimes no one you are dealing with knows how to fix it and knows no one to ask for help. They can not meet their own implementation deadlines and sometimes there is no one on a technical team dealing with you that has any banking or credit union experience. The is an industry insider phrase when you meet other Fiserv customers called being "Fiserved". It means telling others of your worst stories of dealing with them. Ask around, all CTO's have some doozies.
2
|0
FU

FundamentalFlow on Green Tea Group ·
Great narrative! Many people focus on AI nowadays (including me), and it's refreshing to see a deep dive into the fundamentals of a business like Green Tea. I really appreciate how you cut through the market noise to focus on the unit economics and the structural risks.I also write from a fundamentals-first perspective, and I'm currently working on an analysis of Samsung Electronics. I've been trying to refine how I balance factors such as financial health, future, and valuation of a company.If you have a moment, I'd love for you to take a look at my narritives. I'd value your perspective on whether my analysis holds up to the level of rigor you set here. No pressure at all, but I'd appreciate the feedback if you're open to it!
1
|0
