Advertisement
- United States
- /
- Electronic Equipment and Components
- /
- NasdaqGS:NSSC
Does This Valuation Of Napco Security Technologies, Inc. (NASDAQ:NSSC) Imply Investors Are Overpaying?
Key Insights
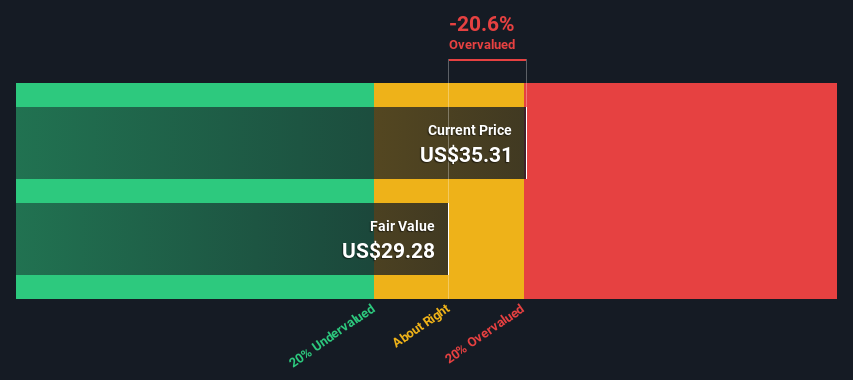
- Using the 2 Stage Free Cash Flow to Equity, Napco Security Technologies fair value estimate is US$29.28
- Napco Security Technologies is estimated to be 21% overvalued based on current share price of US$35.31
- Our fair value estimate is 25% lower than Napco Security Technologies' analyst price target of US$39.25
How far off is Napco Security Technologies, Inc. (NASDAQ:NSSC) from its intrinsic value? Using the most recent financial data, we'll take a look at whether the stock is fairly priced by estimating the company's future cash flows and discounting them to their present value. One way to achieve this is by employing the Discounted Cash Flow (DCF) model. There's really not all that much to it, even though it might appear quite complex.
We generally believe that a company's value is the present value of all of the cash it will generate in the future. However, a DCF is just one valuation metric among many, and it is not without flaws. If you still have some burning questions about this type of valuation, take a look at the Simply Wall St analysis model.
Check out our latest analysis for Napco Security Technologies
Crunching The Numbers
We are going to use a two-stage DCF model, which, as the name states, takes into account two stages of growth. The first stage is generally a higher growth period which levels off heading towards the terminal value, captured in the second 'steady growth' period. To begin with, we have to get estimates of the next ten years of cash flows. Where possible we use analyst estimates, but when these aren't available we extrapolate the previous free cash flow (FCF) from the last estimate or reported value. We assume companies with shrinking free cash flow will slow their rate of shrinkage, and that companies with growing free cash flow will see their growth rate slow, over this period. We do this to reflect that growth tends to slow more in the early years than it does in later years.
A DCF is all about the idea that a dollar in the future is less valuable than a dollar today, so we need to discount the sum of these future cash flows to arrive at a present value estimate:
10-year free cash flow (FCF) estimate
| 2023 | 2024 | 2025 | 2026 | 2027 | 2028 | 2029 | 2030 | 2031 | 2032 | |
| Levered FCF ($, Millions) | US$15.4m | US$43.0m | US$54.7m | US$63.5m | US$71.1m | US$77.4m | US$82.8m | US$87.3m | US$91.2m | US$94.6m |
| Growth Rate Estimate Source | Analyst x1 | Analyst x2 | Analyst x1 | Est @ 16.10% | Est @ 11.90% | Est @ 8.97% | Est @ 6.91% | Est @ 5.47% | Est @ 4.46% | Est @ 3.76% |
| Present Value ($, Millions) Discounted @ 8.5% | US$14.2 | US$36.5 | US$42.8 | US$45.8 | US$47.2 | US$47.4 | US$46.7 | US$45.4 | US$43.7 | US$41.8 |
("Est" = FCF growth rate estimated by Simply Wall St)
Present Value of 10-year Cash Flow (PVCF) = US$411m
The second stage is also known as Terminal Value, this is the business's cash flow after the first stage. The Gordon Growth formula is used to calculate Terminal Value at a future annual growth rate equal to the 5-year average of the 10-year government bond yield of 2.1%. We discount the terminal cash flows to today's value at a cost of equity of 8.5%.
Terminal Value (TV)= FCF2032 × (1 + g) ÷ (r – g) = US$95m× (1 + 2.1%) ÷ (8.5%– 2.1%) = US$1.5b
Present Value of Terminal Value (PVTV)= TV / (1 + r)10= US$1.5b÷ ( 1 + 8.5%)10= US$665m
The total value is the sum of cash flows for the next ten years plus the discounted terminal value, which results in the Total Equity Value, which in this case is US$1.1b. In the final step we divide the equity value by the number of shares outstanding. Compared to the current share price of US$35.3, the company appears slightly overvalued at the time of writing. Valuations are imprecise instruments though, rather like a telescope - move a few degrees and end up in a different galaxy. Do keep this in mind.
Important Assumptions
The calculation above is very dependent on two assumptions. The first is the discount rate and the other is the cash flows. You don't have to agree with these inputs, I recommend redoing the calculations yourself and playing with them. The DCF also does not consider the possible cyclicality of an industry, or a company's future capital requirements, so it does not give a full picture of a company's potential performance. Given that we are looking at Napco Security Technologies as potential shareholders, the cost of equity is used as the discount rate, rather than the cost of capital (or weighted average cost of capital, WACC) which accounts for debt. In this calculation we've used 8.5%, which is based on a levered beta of 1.079. Beta is a measure of a stock's volatility, compared to the market as a whole. We get our beta from the industry average beta of globally comparable companies, with an imposed limit between 0.8 and 2.0, which is a reasonable range for a stable business.
SWOT Analysis for Napco Security Technologies
Strength
- Earnings growth over the past year exceeded the industry.
- Currently debt free.
Weakness
- Dividend is low compared to the top 25% of dividend payers in the Electronic market.
- Expensive based on P/E ratio and estimated fair value.
Opportunity
- Annual earnings are forecast to grow faster than the American market.
Threat
- Revenue is forecast to grow slower than 20% per year.
Next Steps:
Although the valuation of a company is important, it is only one of many factors that you need to assess for a company. It's not possible to obtain a foolproof valuation with a DCF model. Preferably you'd apply different cases and assumptions and see how they would impact the company's valuation. If a company grows at a different rate, or if its cost of equity or risk free rate changes sharply, the output can look very different. Can we work out why the company is trading at a premium to intrinsic value? For Napco Security Technologies, we've compiled three relevant elements you should assess:
- Risks: Case in point, we've spotted 1 warning sign for Napco Security Technologies you should be aware of.
- Future Earnings: How does NSSC's growth rate compare to its peers and the wider market? Dig deeper into the analyst consensus number for the upcoming years by interacting with our free analyst growth expectation chart.
- Other Solid Businesses: Low debt, high returns on equity and good past performance are fundamental to a strong business. Why not explore our interactive list of stocks with solid business fundamentals to see if there are other companies you may not have considered!
PS. Simply Wall St updates its DCF calculation for every American stock every day, so if you want to find the intrinsic value of any other stock just search here.
Valuation is complex, but we're here to simplify it.
Discover if Napco Security Technologies might be undervalued or overvalued with our detailed analysis, featuring fair value estimates, potential risks, dividends, insider trades, and its financial condition.
Access Free AnalysisHave feedback on this article? Concerned about the content? Get in touch with us directly. Alternatively, email editorial-team (at) simplywallst.com.
This article by Simply Wall St is general in nature. We provide commentary based on historical data and analyst forecasts only using an unbiased methodology and our articles are not intended to be financial advice. It does not constitute a recommendation to buy or sell any stock, and does not take account of your objectives, or your financial situation. We aim to bring you long-term focused analysis driven by fundamental data. Note that our analysis may not factor in the latest price-sensitive company announcements or qualitative material. Simply Wall St has no position in any stocks mentioned.
About NasdaqGS:NSSC
Napco Security Technologies
Engages in the development, manufacturing, and sale of electronic security systems for commercial, residential, institutional, industrial, and governmental applications in the United States and internationally.
Flawless balance sheet with moderate growth potential.
Similar Companies
Market Insights


Advertisement
Weekly Picks
LO


Lou_Basenese on Giftify ·
Giftify ($GIFT): A Small-Cap Incentives Platform with More ScaleThan Its Valuation Suggests
Fair Value:US$2.564.5% undervalued
62 followersusers have followed this narrative
2 commentsusers have commented on this narrative
11 likesusers have liked this narrative
HA


HarishPK on lululemon athletica ·
Quantifying the Transition: Why Lululemon’s Moat Remains Intact
Fair Value:US$161.825.6% undervalued
24 followersusers have followed this narrative
2 commentsusers have commented on this narrative
9 likesusers have liked this narrative
TR


tripledub on Alphabet ·
Warren Buffett Just Bet $10 Billion on Google. The Catch? You May Already Be Too Late.
Fair Value:US$23053.3% overvalued
66 followersusers have followed this narrative
1 commentusers have commented on this narrative
17 likesusers have liked this narrative
JO


John_Eric on Veeva Systems ·
AI-Powered Veeva Systems Poised for Solid Growth Amid Regulatory Stability
Fair Value:US$32038.5% undervalued
33 followersusers have followed this narrative
0 commentsusers have commented on this narrative
6 likesusers have liked this narrative
Recently Updated Narratives
BR

browser on Bentley Systems ·
Bentley Systems’ Strategic Positioning in the Digital Infrastructure Cycle
Fair Value:US$15.72102.0% overvalued
1 followerusers have followed this narrative
0 commentsusers have commented on this narrative
0 likesusers have liked this narrative
BE

benjamin_lvieq on PayPal Holdings ·
PayPal: PayPal Doesn't Need to Grow – It Needs to Stop Falling – A Mispriced Cash Machine With a Cannibal Buyback
Fair Value:US$6526.7% undervalued
14 followersusers have followed this narrative
0 commentsusers have commented on this narrative
0 likesusers have liked this narrative
AR

ariz_scribe on Marti Technologies ·
$MRT at Roth - Pick of the Panel
Fair Value:US$1.9628.6% undervalued
5 followersusers have followed this narrative
0 commentsusers have commented on this narrative
0 likesusers have liked this narrative
Popular Narratives
IN


Investingwilly on Mastercard ·
Mastercard: The Best Dividend Stock You're Ignoring
Fair Value:US$75028.3% undervalued
89 followersusers have followed this narrative
1 commentusers have commented on this narrative
9 likesusers have liked this narrative
BL


BlackGoat on Cerebras Systems ·
The Wafer Giant Threatening NVIDIA's GPU Hegemony
Fair Value:US$415.5450.8% undervalued
61 followersusers have followed this narrative
3 commentsusers have commented on this narrative
11 likesusers have liked this narrative
CE


Ceazar on Conexeu Sciences ·
This small biotech is developing technology that could potentially change how tissue is rebuilt
Fair Value:US$25.3459.2% undervalued
60 followersusers have followed this narrative
0 commentsusers have commented on this narrative
9 likesusers have liked this narrative
