
Advertisement
- United States
- /
- Electronic Equipment and Components
- /
- NasdaqGS:ITRI
Is There An Opportunity With Itron, Inc.'s (NASDAQ:ITRI) 35% Undervaluation?

Key Insights
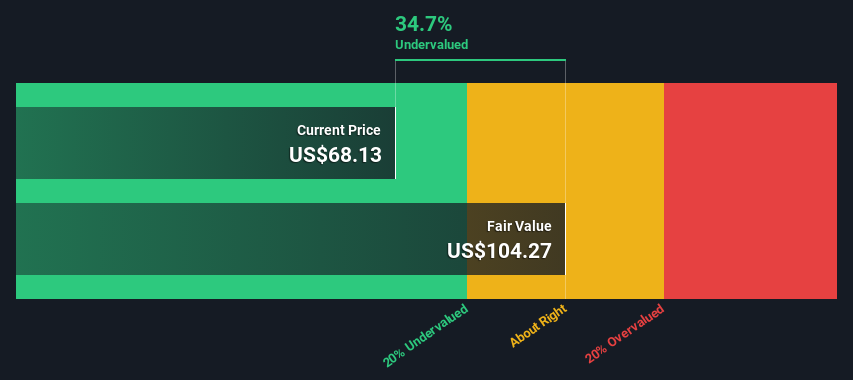
- Using the 2 Stage Free Cash Flow to Equity, Itron fair value estimate is US$104
- Itron is estimated to be 35% undervalued based on current share price of US$68.13
- Analyst price target for ITRI is US$70.25 which is 33% below our fair value estimate
Does the June share price for Itron, Inc. (NASDAQ:ITRI) reflect what it's really worth? Today, we will estimate the stock's intrinsic value by taking the forecast future cash flows of the company and discounting them back to today's value. We will use the Discounted Cash Flow (DCF) model on this occasion. Models like these may appear beyond the comprehension of a lay person, but they're fairly easy to follow.
Remember though, that there are many ways to estimate a company's value, and a DCF is just one method. For those who are keen learners of equity analysis, the Simply Wall St analysis model here may be something of interest to you.
See our latest analysis for Itron
The Method
We are going to use a two-stage DCF model, which, as the name states, takes into account two stages of growth. The first stage is generally a higher growth period which levels off heading towards the terminal value, captured in the second 'steady growth' period. To begin with, we have to get estimates of the next ten years of cash flows. Where possible we use analyst estimates, but when these aren't available we extrapolate the previous free cash flow (FCF) from the last estimate or reported value. We assume companies with shrinking free cash flow will slow their rate of shrinkage, and that companies with growing free cash flow will see their growth rate slow, over this period. We do this to reflect that growth tends to slow more in the early years than it does in later years.
Generally we assume that a dollar today is more valuable than a dollar in the future, so we need to discount the sum of these future cash flows to arrive at a present value estimate:
10-year free cash flow (FCF) estimate
| 2023 | 2024 | 2025 | 2026 | 2027 | 2028 | 2029 | 2030 | 2031 | 2032 | |
| Levered FCF ($, Millions) | US$75.8m | US$123.8m | US$195.4m | US$253.0m | US$306.9m | US$354.6m | US$395.4m | US$429.7m | US$458.6m | US$483.1m |
| Growth Rate Estimate Source | Analyst x3 | Analyst x5 | Analyst x2 | Est @ 29.51% | Est @ 21.29% | Est @ 15.54% | Est @ 11.51% | Est @ 8.69% | Est @ 6.72% | Est @ 5.33% |
| Present Value ($, Millions) Discounted @ 9.1% | US$69.5 | US$104 | US$151 | US$179 | US$199 | US$211 | US$215 | US$215 | US$210 | US$203 |
("Est" = FCF growth rate estimated by Simply Wall St)
Present Value of 10-year Cash Flow (PVCF) = US$1.8b
We now need to calculate the Terminal Value, which accounts for all the future cash flows after this ten year period. The Gordon Growth formula is used to calculate Terminal Value at a future annual growth rate equal to the 5-year average of the 10-year government bond yield of 2.1%. We discount the terminal cash flows to today's value at a cost of equity of 9.1%.
Terminal Value (TV)= FCF2032 × (1 + g) ÷ (r – g) = US$483m× (1 + 2.1%) ÷ (9.1%– 2.1%) = US$7.1b
Present Value of Terminal Value (PVTV)= TV / (1 + r)10= US$7.1b÷ ( 1 + 9.1%)10= US$3.0b
The total value is the sum of cash flows for the next ten years plus the discounted terminal value, which results in the Total Equity Value, which in this case is US$4.7b. The last step is to then divide the equity value by the number of shares outstanding. Relative to the current share price of US$68.1, the company appears quite good value at a 35% discount to where the stock price trades currently. The assumptions in any calculation have a big impact on the valuation, so it is better to view this as a rough estimate, not precise down to the last cent.
Important Assumptions
The calculation above is very dependent on two assumptions. The first is the discount rate and the other is the cash flows. If you don't agree with these result, have a go at the calculation yourself and play with the assumptions. The DCF also does not consider the possible cyclicality of an industry, or a company's future capital requirements, so it does not give a full picture of a company's potential performance. Given that we are looking at Itron as potential shareholders, the cost of equity is used as the discount rate, rather than the cost of capital (or weighted average cost of capital, WACC) which accounts for debt. In this calculation we've used 9.1%, which is based on a levered beta of 1.170. Beta is a measure of a stock's volatility, compared to the market as a whole. We get our beta from the industry average beta of globally comparable companies, with an imposed limit between 0.8 and 2.0, which is a reasonable range for a stable business.
SWOT Analysis for Itron
Strength
- Debt is well covered by earnings.
Weakness
- No major weaknesses identified for ITRI.
Opportunity
- Expected to breakeven next year.
- Has sufficient cash runway for more than 3 years based on current free cash flows.
- Trading below our estimate of fair value by more than 20%.
Threat
- Debt is not well covered by operating cash flow.
Moving On:
Whilst important, the DCF calculation ideally won't be the sole piece of analysis you scrutinize for a company. It's not possible to obtain a foolproof valuation with a DCF model. Preferably you'd apply different cases and assumptions and see how they would impact the company's valuation. For instance, if the terminal value growth rate is adjusted slightly, it can dramatically alter the overall result. Why is the intrinsic value higher than the current share price? For Itron, there are three pertinent elements you should consider:
- Financial Health: Does ITRI have a healthy balance sheet? Take a look at our free balance sheet analysis with six simple checks on key factors like leverage and risk.
- Management:Have insiders been ramping up their shares to take advantage of the market's sentiment for ITRI's future outlook? Check out our management and board analysis with insights on CEO compensation and governance factors.
- Other High Quality Alternatives: Do you like a good all-rounder? Explore our interactive list of high quality stocks to get an idea of what else is out there you may be missing!
PS. Simply Wall St updates its DCF calculation for every American stock every day, so if you want to find the intrinsic value of any other stock just search here.
New: AI Stock Screener & Alerts
Our new AI Stock Screener scans the market every day to uncover opportunities.
• Dividend Powerhouses (3%+ Yield)
• Undervalued Small Caps with Insider Buying
• High growth Tech and AI Companies
Or build your own from over 50 metrics.
Have feedback on this article? Concerned about the content? Get in touch with us directly. Alternatively, email editorial-team (at) simplywallst.com.
This article by Simply Wall St is general in nature. We provide commentary based on historical data and analyst forecasts only using an unbiased methodology and our articles are not intended to be financial advice. It does not constitute a recommendation to buy or sell any stock, and does not take account of your objectives, or your financial situation. We aim to bring you long-term focused analysis driven by fundamental data. Note that our analysis may not factor in the latest price-sensitive company announcements or qualitative material. Simply Wall St has no position in any stocks mentioned.
About NasdaqGS:ITRI
Itron
A technology, solutions, and service company, provides end-to-end solutions that help manage energy, water, and smart city operations worldwide.
Undervalued with solid track record.
Similar Companies
Market Insights

Advertisement
Community Narratives
The Most Undervalued of the Magnificent 7
Fair Value US$237.43|34.2% undervalued
IN
Community Contributor
PVA TePla's New Strategy Aims for 22% Revenue Growth in Semiconductor Recovery
Fair Value €19.19|19.8% undervalued
MI
Community Contributor