
Advertisement
- United States
- /
- Electronic Equipment and Components
- /
- NasdaqGM:FEIM
Even though Frequency Electronics (NASDAQ:FEIM) has lost US$51m market cap in last 7 days, shareholders are still up 780% over 3 years
For us, stock picking is in large part the hunt for the truly magnificent stocks. Not every pick can be a winner, but when you pick the right stock, you can win big. One bright shining star stock has been Frequency Electronics, Inc. (NASDAQ:FEIM), which is 712% higher than three years ago. It's also good to see the share price up 41% over the last quarter. We love happy stories like this one. The company should be really proud of that performance!
In light of the stock dropping 9.0% in the past week, we want to investigate the longer term story, and see if fundamentals have been the driver of the company's positive three-year return.
In his essay The Superinvestors of Graham-and-Doddsville Warren Buffett described how share prices do not always rationally reflect the value of a business. One way to examine how market sentiment has changed over time is to look at the interaction between a company's share price and its earnings per share (EPS).
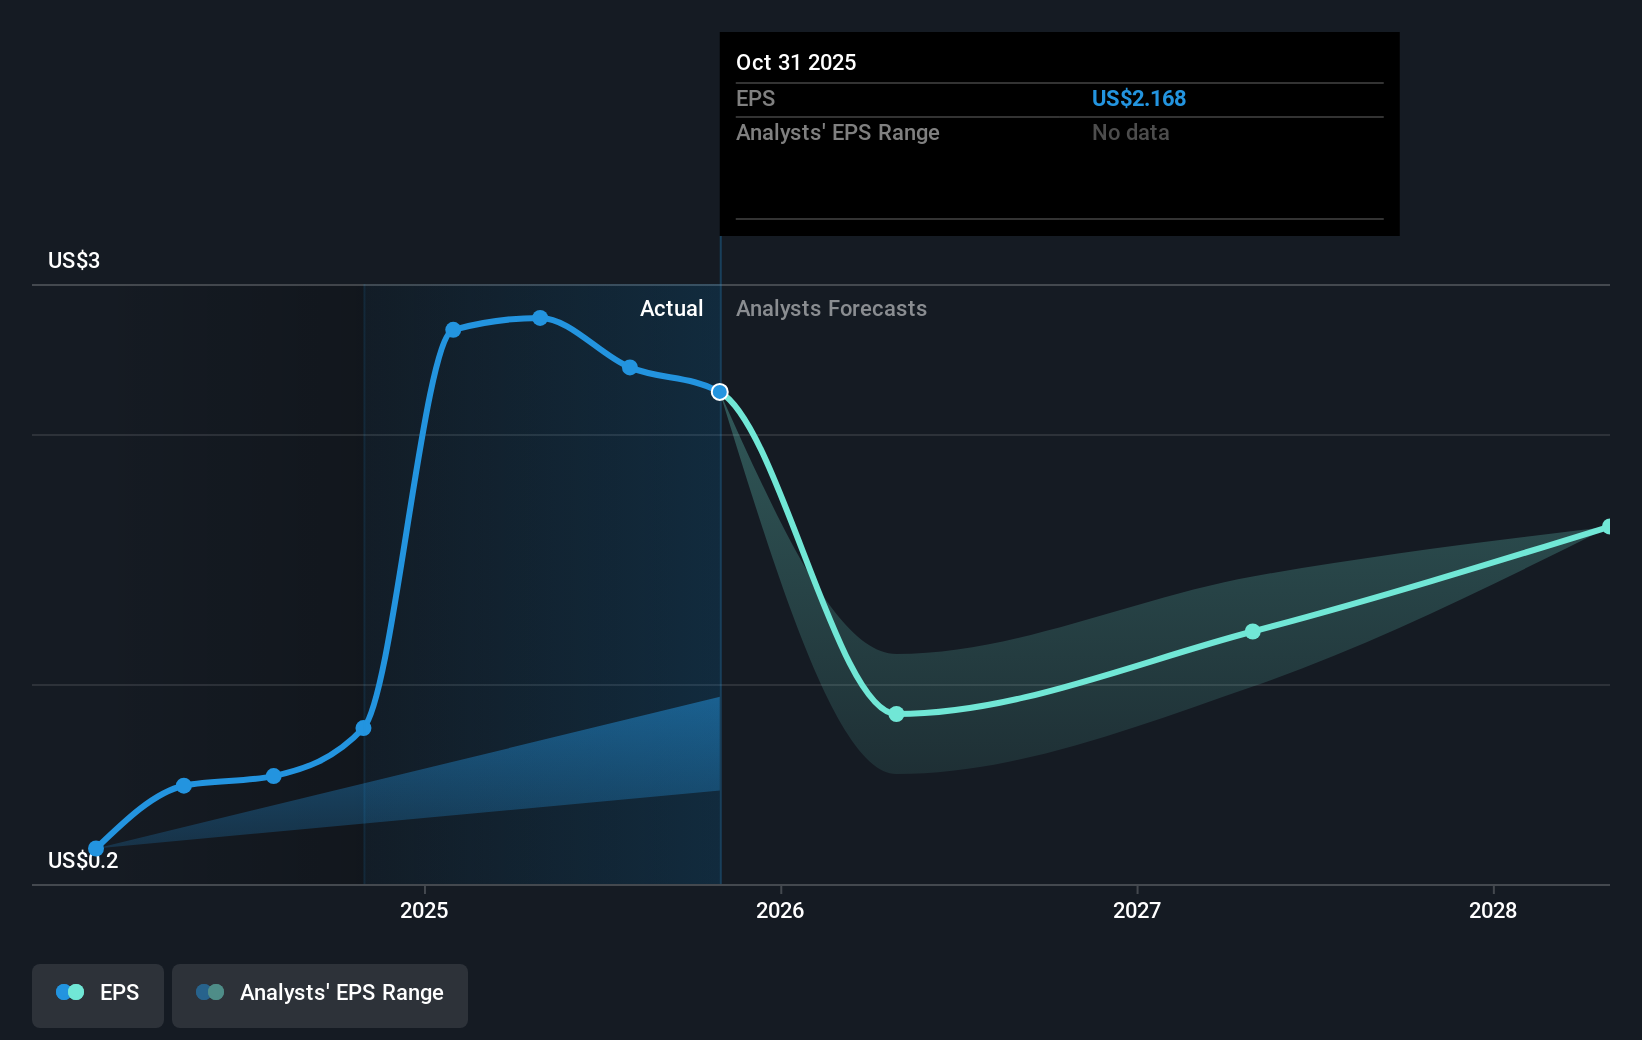
During three years of share price growth, Frequency Electronics moved from a loss to profitability. Given the importance of this milestone, it's not overly surprising that the share price has increased strongly.
You can see below how EPS has changed over time (discover the exact values by clicking on the image).
It's probably worth noting that the CEO is paid less than the median at similar sized companies. But while CEO remuneration is always worth checking, the really important question is whether the company can grow earnings going forward. Before buying or selling a stock, we always recommend a close examination of historic growth trends, available here..
What About The Total Shareholder Return (TSR)?
Investors should note that there's a difference between Frequency Electronics' total shareholder return (TSR) and its share price change, which we've covered above. The TSR is a return calculation that accounts for the value of cash dividends (assuming that any dividend received was reinvested) and the calculated value of any discounted capital raisings and spin-offs. Frequency Electronics hasn't been paying dividends, but its TSR of 780% exceeds its share price return of 712%, implying it has either spun-off a business, or raised capital at a discount; thereby providing additional value to shareholders.
A Different Perspective
It's good to see that Frequency Electronics has rewarded shareholders with a total shareholder return of 181% in the last twelve months. Since the one-year TSR is better than the five-year TSR (the latter coming in at 44% per year), it would seem that the stock's performance has improved in recent times. Given the share price momentum remains strong, it might be worth taking a closer look at the stock, lest you miss an opportunity. I find it very interesting to look at share price over the long term as a proxy for business performance. But to truly gain insight, we need to consider other information, too. Take risks, for example - Frequency Electronics has 2 warning signs (and 1 which doesn't sit too well with us) we think you should know about.
If you would prefer to check out another company -- one with potentially superior financials -- then do not miss this free list of companies that have proven they can grow earnings.
Please note, the market returns quoted in this article reflect the market weighted average returns of stocks that currently trade on American exchanges.
New: AI Stock Screener & Alerts
Our new AI Stock Screener scans the market every day to uncover opportunities.
• Dividend Powerhouses (3%+ Yield)
• Undervalued Small Caps with Insider Buying
• High growth Tech and AI Companies
Or build your own from over 50 metrics.
Have feedback on this article? Concerned about the content? Get in touch with us directly. Alternatively, email editorial-team (at) simplywallst.com.
This article by Simply Wall St is general in nature. We provide commentary based on historical data and analyst forecasts only using an unbiased methodology and our articles are not intended to be financial advice. It does not constitute a recommendation to buy or sell any stock, and does not take account of your objectives, or your financial situation. We aim to bring you long-term focused analysis driven by fundamental data. Note that our analysis may not factor in the latest price-sensitive company announcements or qualitative material. Simply Wall St has no position in any stocks mentioned.
MI

The Foxhole
Druckenmiller says cheap money's days are numbered. Boring, self-funding companies could be the opportunity.
1311
DE
devon_jd150
Leverage on its own is close to useless as a screen right now, because so much corporate debt was termed out at 2 to 3% and has not repriced. A business at three times leverage with nothing due until 2031 is in a completely different position from the same ratio rolling next year. Screen on weighted average maturity and the schedule behind it.
LE
LeverageIsLovely
In my view, Insurance companies are best positioned for this.
 Mitchell Lawler
Market Insights
Which payment stocks actually get paid?

Every new payment app was supposed to kill Visa and Mastercard. Instead, they got bigger. So what does that mean for the payment stocks on your radar?
32
About NasdaqGM:FEIM
Frequency Electronics
Engages in the design, development, manufacture, marketing, and sale of precision time and frequency control products and components for microwave integrated circuit applications.
Adequate balance sheet with limited growth.
Similar Companies
Market Insights


Advertisement
Weekly Picks
RI


Rick_Orford on Starfighters Space ·
The 1960s Fighter Jet That Could Crack Open a $20 Billion Satellite Market
Fair Value:US$522.8% undervalued
67 followersusers have followed this narrative
4 commentsusers have commented on this narrative
11 likesusers have liked this narrative
TR


tripledub on Meta Platforms ·
The $135 Billion Bet That Should Make Every Shareholder Nervous
Fair Value:US$5862.7% undervalued
48 followersusers have followed this narrative
3 commentsusers have commented on this narrative
34 likesusers have liked this narrative
TA


Talos on Voyager Technologies ·
The "Landlord of Orbit" – A Deep Value Play Ahead of the Starlab Era
Fair Value:US$385.291.0% undervalued
31 followersusers have followed this narrative
0 commentsusers have commented on this narrative
5 likesusers have liked this narrative
IV

Ivoed on Uber Technologies ·
Uber’s Valuation Depends On Who Captures The Economics Of Driverless Rides
Fair Value:US$11630.7% undervalued
7 followersusers have followed this narrative
0 commentsusers have commented on this narrative
3 likesusers have liked this narrative
Recently Updated Narratives
WO


woodworthfund on Kraft Heinz ·
Kraft Heinz (KHC): Less Drama, More Ketchup
Fair Value:US$3527.7% undervalued
27 followersusers have followed this narrative
0 commentsusers have commented on this narrative
0 likesusers have liked this narrative
LU


LunaRodas on DICK'S Sporting Goods ·
DKS | DICK'S Sporting Goods: What They Said vs. What They Did
Fair Value:US$112.7710.2% overvalued
1 followerusers have followed this narrative
0 commentsusers have commented on this narrative
0 likesusers have liked this narrative
PR


prajeeshprathap on Medpace Holdings ·
Why Medpace Outperforms Competitors in the Mid-Sized Biotech Niche
Fair Value:US$53614.6% overvalued
1 followerusers have followed this narrative
0 commentsusers have commented on this narrative
0 likesusers have liked this narrative
Popular Narratives
OS


oscargarcia on NVIDIA ·
The company that went from selling GPUs to gamers to becoming the AI arms dealer of the 21st century.
Fair Value:US$28023.9% undervalued
355 followersusers have followed this narrative
9 commentsusers have commented on this narrative
16 likesusers have liked this narrative
CU

CubanEros on Microsoft ·
A wonderful business at reasonable price.
Fair Value:US$419.9117.1% overvalued
203 followersusers have followed this narrative
0 commentsusers have commented on this narrative
9 likesusers have liked this narrative
KI

KiwiInvest on Amazon.com ·
Amazon's high growth, high tech segments propel its profits, while traditional segments plod along
Fair Value:US$475.0945.1% undervalued
228 followersusers have followed this narrative
1 commentusers have commented on this narrative
8 likesusers have liked this narrative
Trending Discussion


JO
johnk72 on Global X AI Infrastructure ETF ·
Great picks & shovels investment. I hold 3,000 units with a plan to hold until the end of 2028
2
|0