Advertisement
- United States
- /
- Tech Hardware
- /
- NasdaqGS:AAPL
What Does Apple's China Growth Mean for Future Returns?

Reviewed by Bailey Pemberton
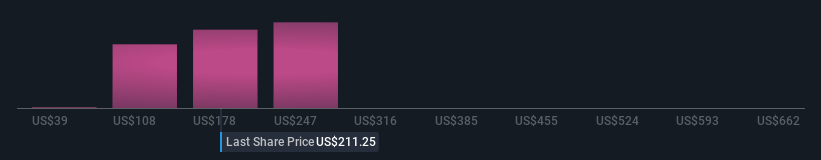
If you are wondering what to do with your Apple shares right now, you are not alone. Apple stock has seen its fair share of ups and downs lately, making it the center of debates at kitchen tables and brokerage desks alike. Over the past month, the stock is up 5.9%, though it pulled back 3.4% over the last week. Looking further back, the stock is still up an impressive 116.8% over five years. This mix of short-term volatility and long-term strength leaves investors curious about what is driving the story and whether more gains could be ahead.
Recent headlines provide some clues about why Apple's share price keeps moving. The company has navigated international intrigue, such as lobbying India to tweak income tax laws that could affect its manufacturing operations or boosting investments in China, a key market even as supply chains shift. Apple even managed to see its shipments tick higher in China in Q3, bucking a broader slowdown hitting the industry. On the product front, the company’s willingness to evolve, including rebranding their streaming service and hinting at new hardware, shows the kind of adaptability you want in a tech giant.
But what about valuation? Apple currently scores a 1 out of 6 on undervaluation checks, suggesting that it is only undervalued by one measure. That could be a red flag for bargain hunters or just another layer in a complex story. Next, let’s break down these common valuation approaches, and stick around because there may be an even better lens through which to judge Apple’s true worth.
Apple scores just 1/6 on our valuation checks. See what other red flags we found in the full valuation breakdown.
Approach 1: Apple Discounted Cash Flow (DCF) Analysis
The Discounted Cash Flow (DCF) model estimates a company's intrinsic value by projecting its future cash flows and discounting them back to today’s dollars. This approach aims to determine what Apple’s business is truly worth, based on expected cash generation.
Currently, Apple generates $97.1 Billion in Free Cash Flow (FCF) annually. Analyst estimates show this figure is expected to grow steadily, reaching about $188.9 Billion by 2030. It is important to note that forecasts after 2028 are extrapolated by Simply Wall St because analyst consensus typically only covers the next five years. Still, the growth trajectory is significant and supports a strong outlook for Apple's ability to generate future cash flows.
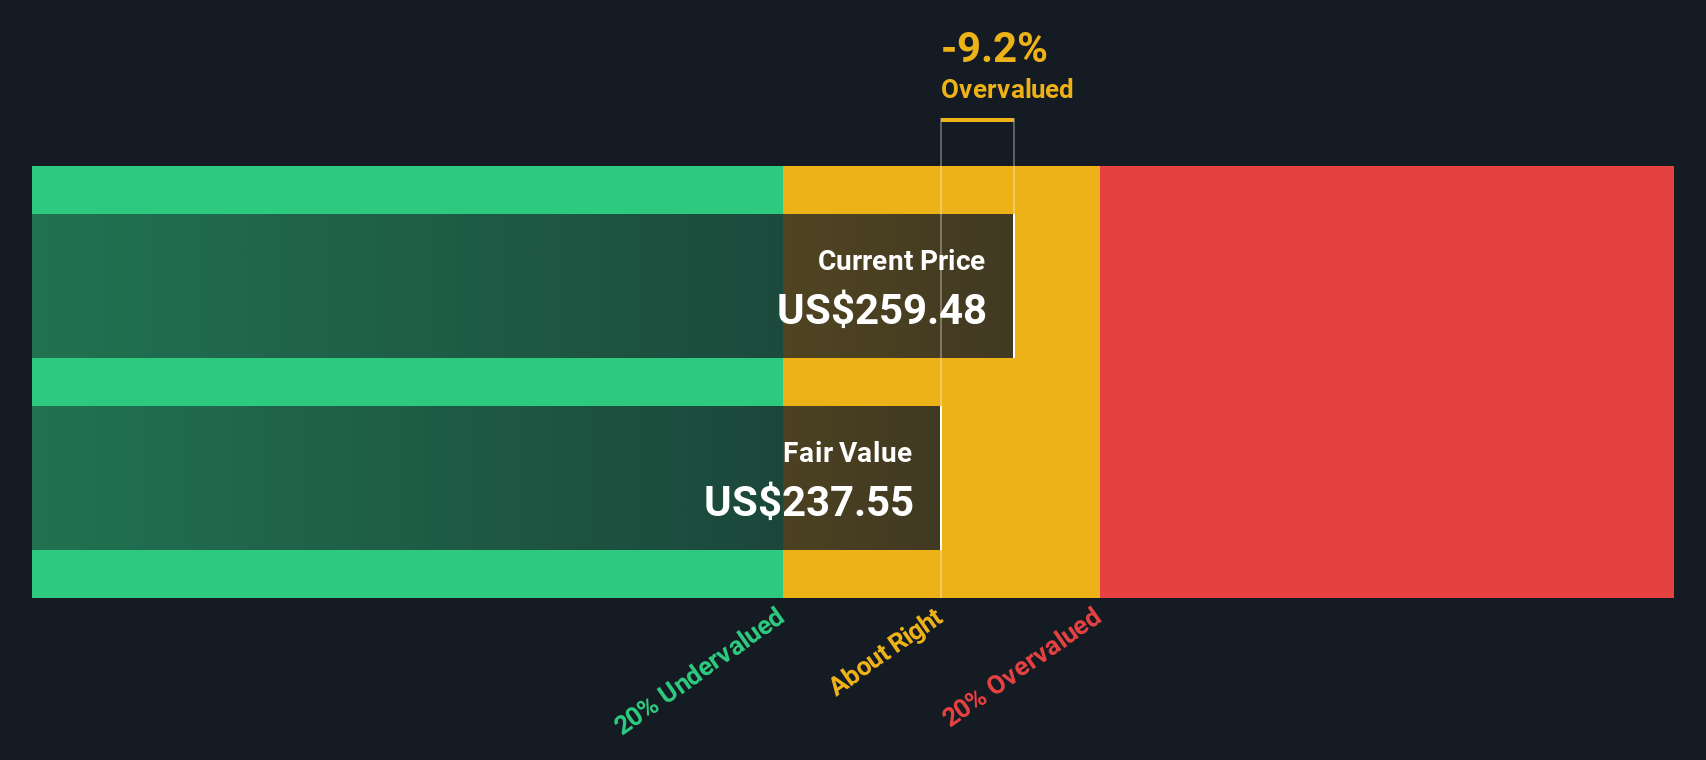
After discounting all these projected cash flows using a 2 Stage Free Cash Flow to Equity model, Apple’s intrinsic value comes out to $218.97 per share. However, this result suggests the stock is currently trading at a 13.2% premium to its intrinsic value, meaning it is overvalued by DCF standards.
Result: OVERVALUED
Our Discounted Cash Flow (DCF) analysis suggests Apple may be overvalued by 13.2%. Find undervalued stocks or create your own screener to find better value opportunities.
Approach 2: Apple Price vs Earnings (PE)
For highly profitable companies like Apple, the Price-to-Earnings (PE) ratio is a popular and widely accepted valuation tool. It tells us how much investors are paying for each dollar of earnings, providing a quick way to gauge whether a stock is considered expensive or reasonable relative to its profits.
What qualifies as a “normal” or “fair” PE ratio depends on several factors, primarily the company’s growth expectations and risk profile. Faster-growing, lower-risk businesses typically command higher PE ratios, while mature or riskier firms generally see lower multiples.
Currently, Apple trades at a PE ratio of 37x. This stands above its industry average of 23x and is also higher than the average for its peers at 35x. At first glance, this premium might make the stock appear pricey. However, simply comparing to industry or peers does not always paint the full picture, especially for a business with Apple's scale and profitability.
This is where Simply Wall St's "Fair Ratio" comes in. The Fair Ratio, here calculated at 42x for Apple, incorporates more than just sector averages. It accounts for Apple’s unique profile, including its earnings growth, industry dynamics, profit margins, market cap, and key risks. This holistic approach gives a more customized benchmark for fair valuation, rather than a one-size-fits-all comparison.
Apple’s current PE ratio of 37x sits slightly below the Fair Ratio of 42x. The difference suggests that, despite the appearance of a premium, the stock is actually valued about right compared to its customized fair value benchmark.
Result: ABOUT RIGHT

PE ratios tell one story, but what if the real opportunity lies elsewhere? Discover companies where insiders are betting big on explosive growth.
Upgrade Your Decision Making: Choose your Apple Narrative
Earlier we mentioned there is an even better way to understand valuation, so let’s introduce you to Narratives, an innovative and accessible approach where you define your perspective on the company’s future, linking Apple’s story to a financial forecast and fair value.
A Narrative goes beyond just numbers; it is your personal take on Apple’s prospects, expressing how you see its business evolving, what revenue growth and margins you expect, and what you believe a fair price should be.
On Simply Wall St’s Community page, millions of investors use Narratives to map their view of Apple’s future and then track if the latest news or earnings shift those assumptions. This means your fair value estimate adapts as the facts change.
By comparing your Narrative’s fair value with the current price, you get a clear signal to buy or sell, all grounded in your unique reasoning and up-to-date information, not just headline multiples.
For example, while some investors see Apple’s fair value as high as $275, banking on AI-driven growth and resilience, others put it as low as $177, concerned about slowing product innovation, rising costs, or market maturity. This demonstrates how Narratives put the power of interpretation in your hands.
For Apple, we’ll make it really easy for you with previews of two leading Apple Narratives:
- 🐂 Apple Bull Case
Fair Value: $275.00
Undervalued by: 9.86%
Forecast Revenue Growth: 12.78%
- Apple is weathering steep U.S. tariffs, with up to 145% taxes on Chinese imports threatening margins. The company is actively shifting production to India and Vietnam to offset these risks.
- Despite these pressures, Apple continues to post robust profits and beat earnings estimates in Q1 2025. Analysts see potential upside with price targets as high as $275, attributed to AI investment and services revenue strength.
- Short-term volatility may persist. However, brand loyalty, strong financials, and an aggressive AI strategy support a resilient, long-term growth outlook.
- 🐻 Apple Bear Case
Fair Value: $207.71
Overvalued by: 19.31%
Forecast Revenue Growth: 6.39%
- Apple faces margin erosion and sales pressure from costly compliance with EU regulations, increasing R&D expenditure, and the end of lucrative service deals. Risky bets on new technology may not deliver the expected results.
- Poor emerging market strategy, particularly in India and South America, means penetrating these markets could prove uneconomical, especially with iPhones priced far above average incomes.
- Supply chain shifts to the U.S. and changes such as mandatory USB-C ports may cut into licensing and service revenues. Product innovation in core hardware might also no longer drive meaningful growth.
Do you think there's more to the story for Apple? Create your own Narrative to let the Community know!
This article by Simply Wall St is general in nature. We provide commentary based on historical data and analyst forecasts only using an unbiased methodology and our articles are not intended to be financial advice. It does not constitute a recommendation to buy or sell any stock, and does not take account of your objectives, or your financial situation. We aim to bring you long-term focused analysis driven by fundamental data. Note that our analysis may not factor in the latest price-sensitive company announcements or qualitative material. Simply Wall St has no position in any stocks mentioned.
New: Manage All Your Stock Portfolios in One Place
We've created the ultimate portfolio companion for stock investors, and it's free.
• Connect an unlimited number of Portfolios and see your total in one currency
• Be alerted to new Warning Signs or Risks via email or mobile
• Track the Fair Value of your stocks
Have feedback on this article? Concerned about the content? Get in touch with us directly. Alternatively, email editorial-team@simplywallst.com
About NasdaqGS:AAPL
Apple
Designs, manufactures, and markets smartphones, personal computers, tablets, wearables, and accessories worldwide.
Outstanding track record with excellent balance sheet.
Similar Companies
Market Insights


Advertisement
Weekly Picks
LO


Lou_Basenese on Cue Biopharma ·
Cue Biopharma (NASDAQ: CUE): The Scientist Behind Xolair Just Gave Cue a Next-Generation Shot at the Same Multi-Billion-Dollar Market
Fair Value:US$7057.7% undervalued
9 followersusers have followed this narrative
0 commentsusers have commented on this narrative
4 likesusers have liked this narrative
HE


HedgeY on AST SpaceMobile ·
AST SpaceMobile: The Boldest Direct-to-Cell Bet in Public Markets
Fair Value:US$17036.9% undervalued
33 followersusers have followed this narrative
0 commentsusers have commented on this narrative
10 likesusers have liked this narrative
FU

FundamentalFlow on Onto Innovation ·
Onto Innovation: The Advanced Packaging Chokepoint 51.3% undervalued intrinsic discount
Fair Value:US$38027.7% undervalued
23 followersusers have followed this narrative
0 commentsusers have commented on this narrative
6 likesusers have liked this narrative
MA


martinarauz on Nu Holdings ·
Investment Analysis (May 2026)
Fair Value:US$22.7446.7% undervalued
55 followersusers have followed this narrative
0 commentsusers have commented on this narrative
14 likesusers have liked this narrative
Recently Updated Narratives
IM


Imthetxarbi on Sylvania Platinum ·
A Debt-Free PGM Producer Trading at 2x EBITDA With a 10% Dividend Yield Nobody Is Talking About
Fair Value:UK£2.0855.3% undervalued
1 followerusers have followed this narrative
0 commentsusers have commented on this narrative
0 likesusers have liked this narrative
MI


Miracleworker on Diversified Energy ·
DEC.L: Dip-Buying Opp, 8%+ Div & 57-100% Potential Gain Over 12 Months
Fair Value:UK£10.460% overvalued
1 followerusers have followed this narrative
0 commentsusers have commented on this narrative
0 likesusers have liked this narrative
IM

Imthetxarbi on Watches of Switzerland Group ·
A Compelling Compounder at a Retailer's Multiple
Fair Value:UK£1134.8% undervalued
1 followerusers have followed this narrative
0 commentsusers have commented on this narrative
0 likesusers have liked this narrative
Popular Narratives
GO

GoldenSands on QuantumScape ·
QuantumScape: A Mispriced Deep‑Tech Inflection Point With Multi‑Billion‑Dollar Optionality
Fair Value:US$8589.3% undervalued
124 followersusers have followed this narrative
3 commentsusers have commented on this narrative
36 likesusers have liked this narrative
CL


Clive_Thompson on Take-Two Interactive Software ·
Take-Two Interactive: The Calm Before the Storm NASDAQ: TTWO Last Price: $242.41 Date: May 15, 2026
Fair Value:US$276.9721.8% undervalued
56 followersusers have followed this narrative
0 commentsusers have commented on this narrative
14 likesusers have liked this narrative
NI


niteco on Honeywell International ·
Honeywell - The Demand-Side of the AI Infrastructure
Fair Value:US$320.1932.0% undervalued
46 followersusers have followed this narrative
0 commentsusers have commented on this narrative
19 likesusers have liked this narrative
Trending Discussion

FR

FrontierTom on United States Antimony ·
Great Long term play that needs great tolerance for price swings along the way.
0
|0
