
Advertisement
- United States
- /
- Software
- /
- NYSE:RAMP
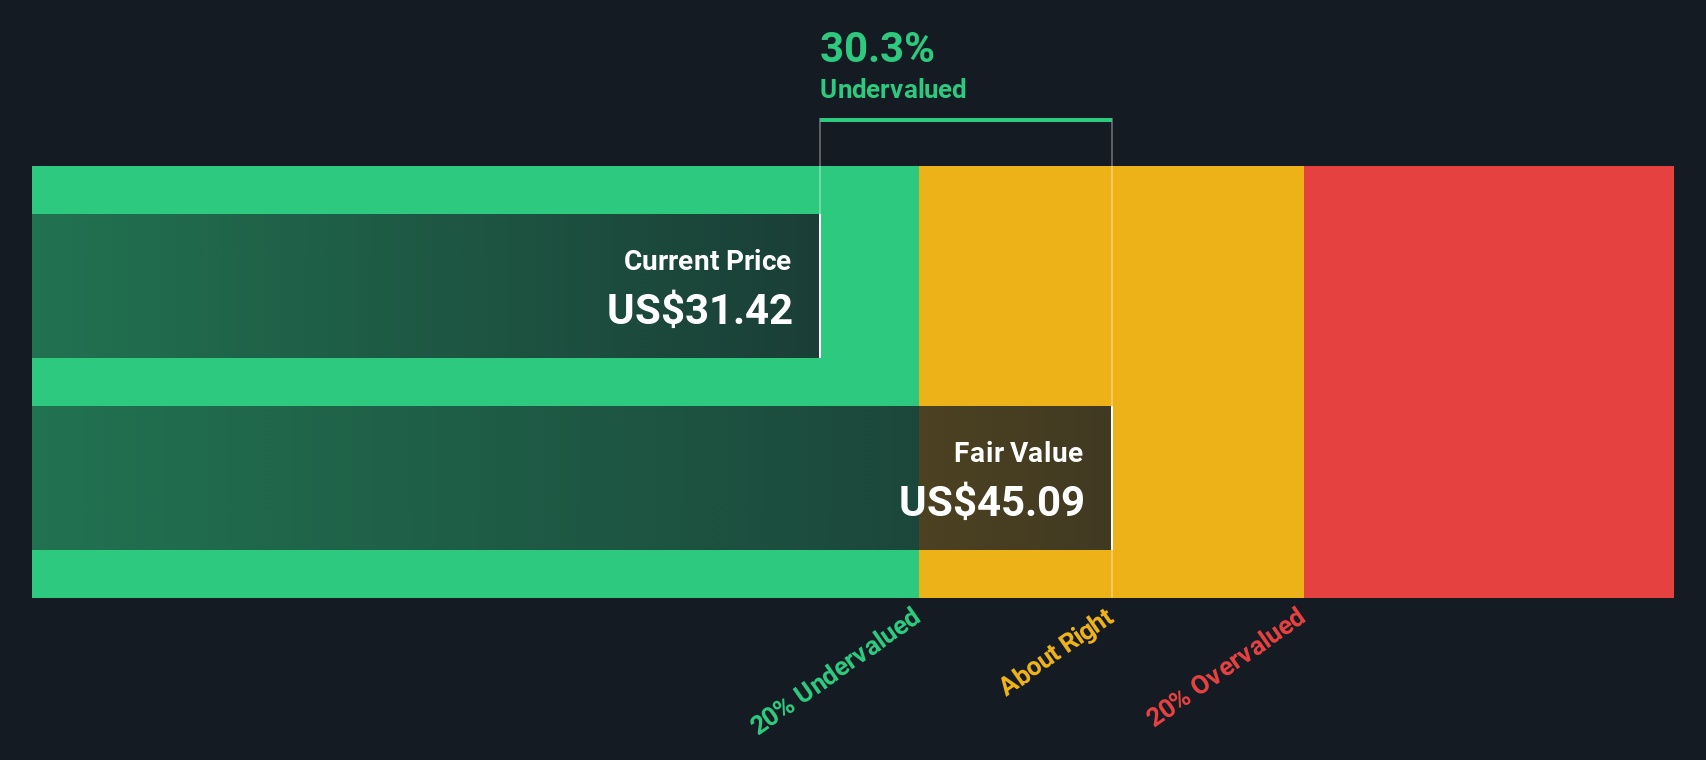
LiveRamp Holdings, Inc. (NYSE:RAMP) Shares Could Be 30% Below Their Intrinsic Value Estimate
Key Insights
- Using the 2 Stage Free Cash Flow to Equity, LiveRamp Holdings fair value estimate is US$45.09
- LiveRamp Holdings is estimated to be 30% undervalued based on current share price of US$31.42
- Our fair value estimate is 16% higher than LiveRamp Holdings' analyst price target of US$38.71
How far off is LiveRamp Holdings, Inc. (NYSE:RAMP) from its intrinsic value? Using the most recent financial data, we'll take a look at whether the stock is fairly priced by taking the expected future cash flows and discounting them to their present value. Our analysis will employ the Discounted Cash Flow (DCF) model. Believe it or not, it's not too difficult to follow, as you'll see from our example!
We generally believe that a company's value is the present value of all of the cash it will generate in the future. However, a DCF is just one valuation metric among many, and it is not without flaws. For those who are keen learners of equity analysis, the Simply Wall St analysis model here may be something of interest to you.
The Method
We use what is known as a 2-stage model, which simply means we have two different periods of growth rates for the company's cash flows. Generally the first stage is higher growth, and the second stage is a lower growth phase. To start off with, we need to estimate the next ten years of cash flows. Where possible we use analyst estimates, but when these aren't available we extrapolate the previous free cash flow (FCF) from the last estimate or reported value. We assume companies with shrinking free cash flow will slow their rate of shrinkage, and that companies with growing free cash flow will see their growth rate slow, over this period. We do this to reflect that growth tends to slow more in the early years than it does in later years.
A DCF is all about the idea that a dollar in the future is less valuable than a dollar today, and so the sum of these future cash flows is then discounted to today's value:
10-year free cash flow (FCF) estimate
| 2025 | 2026 | 2027 | 2028 | 2029 | 2030 | 2031 | 2032 | 2033 | 2034 | |
| Levered FCF ($, Millions) | US$105.3m | US$155.0m | US$158.5m | US$162.2m | US$166.3m | US$170.7m | US$175.4m | US$180.3m | US$185.4m | US$190.8m |
| Growth Rate Estimate Source | Analyst x1 | Analyst x2 | Analyst x1 | Est @ 2.35% | Est @ 2.52% | Est @ 2.65% | Est @ 2.74% | Est @ 2.80% | Est @ 2.84% | Est @ 2.87% |
| Present Value ($, Millions) Discounted @ 7.9% | US$97.6 | US$133 | US$126 | US$120 | US$114 | US$108 | US$103 | US$98.1 | US$93.5 | US$89.1 |
("Est" = FCF growth rate estimated by Simply Wall St)
Present Value of 10-year Cash Flow (PVCF) = US$1.1b
The second stage is also known as Terminal Value, this is the business's cash flow after the first stage. The Gordon Growth formula is used to calculate Terminal Value at a future annual growth rate equal to the 5-year average of the 10-year government bond yield of 2.9%. We discount the terminal cash flows to today's value at a cost of equity of 7.9%.
Terminal Value (TV)= FCF2034 × (1 + g) ÷ (r – g) = US$191m× (1 + 2.9%) ÷ (7.9%– 2.9%) = US$4.0b
Present Value of Terminal Value (PVTV)= TV / (1 + r)10= US$4.0b÷ ( 1 + 7.9%)10= US$1.8b
The total value is the sum of cash flows for the next ten years plus the discounted terminal value, which results in the Total Equity Value, which in this case is US$2.9b. To get the intrinsic value per share, we divide this by the total number of shares outstanding. Compared to the current share price of US$31.4, the company appears quite good value at a 30% discount to where the stock price trades currently. The assumptions in any calculation have a big impact on the valuation, so it is better to view this as a rough estimate, not precise down to the last cent.
Important Assumptions
Now the most important inputs to a discounted cash flow are the discount rate, and of course, the actual cash flows. Part of investing is coming up with your own evaluation of a company's future performance, so try the calculation yourself and check your own assumptions. The DCF also does not consider the possible cyclicality of an industry, or a company's future capital requirements, so it does not give a full picture of a company's potential performance. Given that we are looking at LiveRamp Holdings as potential shareholders, the cost of equity is used as the discount rate, rather than the cost of capital (or weighted average cost of capital, WACC) which accounts for debt. In this calculation we've used 7.9%, which is based on a levered beta of 1.147. Beta is a measure of a stock's volatility, compared to the market as a whole. We get our beta from the industry average beta of globally comparable companies, with an imposed limit between 0.8 and 2.0, which is a reasonable range for a stable business.
See our latest analysis for LiveRamp Holdings
Next Steps:
Whilst important, the DCF calculation is only one of many factors that you need to assess for a company. The DCF model is not a perfect stock valuation tool. Preferably you'd apply different cases and assumptions and see how they would impact the company's valuation. For example, changes in the company's cost of equity or the risk free rate can significantly impact the valuation. Can we work out why the company is trading at a discount to intrinsic value? For LiveRamp Holdings, we've compiled three additional items you should look at:
- Risks: Be aware that LiveRamp Holdings is showing 1 warning sign in our investment analysis , you should know about...
- Management:Have insiders been ramping up their shares to take advantage of the market's sentiment for RAMP's future outlook? Check out our management and board analysis with insights on CEO compensation and governance factors.
- Other High Quality Alternatives: Do you like a good all-rounder? Explore our interactive list of high quality stocks to get an idea of what else is out there you may be missing!
PS. The Simply Wall St app conducts a discounted cash flow valuation for every stock on the NYSE every day. If you want to find the calculation for other stocks just search here.
New: AI Stock Screener & Alerts
Our new AI Stock Screener scans the market every day to uncover opportunities.
• Dividend Powerhouses (3%+ Yield)
• Undervalued Small Caps with Insider Buying
• High growth Tech and AI Companies
Or build your own from over 50 metrics.
Have feedback on this article? Concerned about the content? Get in touch with us directly. Alternatively, email editorial-team (at) simplywallst.com.
This article by Simply Wall St is general in nature. We provide commentary based on historical data and analyst forecasts only using an unbiased methodology and our articles are not intended to be financial advice. It does not constitute a recommendation to buy or sell any stock, and does not take account of your objectives, or your financial situation. We aim to bring you long-term focused analysis driven by fundamental data. Note that our analysis may not factor in the latest price-sensitive company announcements or qualitative material. Simply Wall St has no position in any stocks mentioned.
About NYSE:RAMP
LiveRamp Holdings
A technology company, operates a data collaboration platform in the United States, Europe, the Asia-Pacific, and internationally.
Flawless balance sheet with solid track record.
Similar Companies
Market Insights

Advertisement
Community Narratives
Finding The True Value Of A Logistics Powerhouse
Fair Value US$95.21|8.4% undervalued
NV
Community Contributor
Paradigm Biopharmaceuticals Will Lead Osteoarthritis Treatment with Zilosul's FDA Success
Fair Value AU$5.50|92.1% undervalued
AM
Community Contributor
Barrick Mining (ABX:CA): A Gold Hedge against a U.S. Shutdown
Fair Value CA$60.00|24.2% undervalued
GM
Community Contributor