Advertisement
- United States
- /
- Software
- /
- NYSE:IOT
Is Samsara’s Stock Price Justified After Recent 24% Drop and Fair Value Checks for 2025?

Simply Wall St
Reviewed by Bailey Pemberton
Trying to decide what to do with Samsara stock? You’re far from alone. Investors have been watching this company’s journey very closely. Some are focused on the big swings, and others are wondering what’s next after the explosive debut and the bumpy roads lately. If you look at Samsara’s recent stock performance, there’s a lot to unpack. Over the past year, the share price is down 24.3%, compounding a slide of 13.5% year-to-date. Even in the last month, returns dipped by 0.6%, and the past week saw a 1.8% decline. However, stepping back just a little provides a reminder of how far Samsara has come: over three years, the stock has climbed by 220.5%. This is a significant gain that still stands out despite recent setbacks.
Some of these ups and downs have been magnified by broader market moves. Risk sentiment across tech stocks has shifted as investors assess both economic outlooks and the changing landscape of enterprise software. While nothing majorly specific to Samsara has made headlines recently, it is part of a sector that is under scrutiny, where rapid growth and high expectations often lead to volatility.
Looking at valuation, Samsara currently earns a score of 1 on our scale, which means it is delivering in just one out of six key undervaluation checks. But what does this actually mean for you as an investor? In the next section, we will break down each valuation approach to explain exactly why the score is where it is, and offer a perspective on valuation that could change how you interpret the numbers.
Samsara scores just 1/6 on our valuation checks. See what other red flags we found in the full valuation breakdown.
Approach 1: Samsara Discounted Cash Flow (DCF) Analysis
A Discounted Cash Flow (DCF) model works by projecting a company’s future cash flows and then discounting them back to today’s value. This approach allows investors to estimate what the business is worth right now, based on how much cash it is expected to generate in the years ahead.
For Samsara, analysts estimate the company’s Free Cash Flow (FCF) for the last twelve months at $166.7 Million. Looking ahead, FCF projections rise rapidly. By 2030, the FCF is expected to reach around $878.1 Million. While the first five years of forecasts come directly from analysts, all subsequent figures are extrapolated, giving us a complete ten-year outlook for what the business might generate in cash.
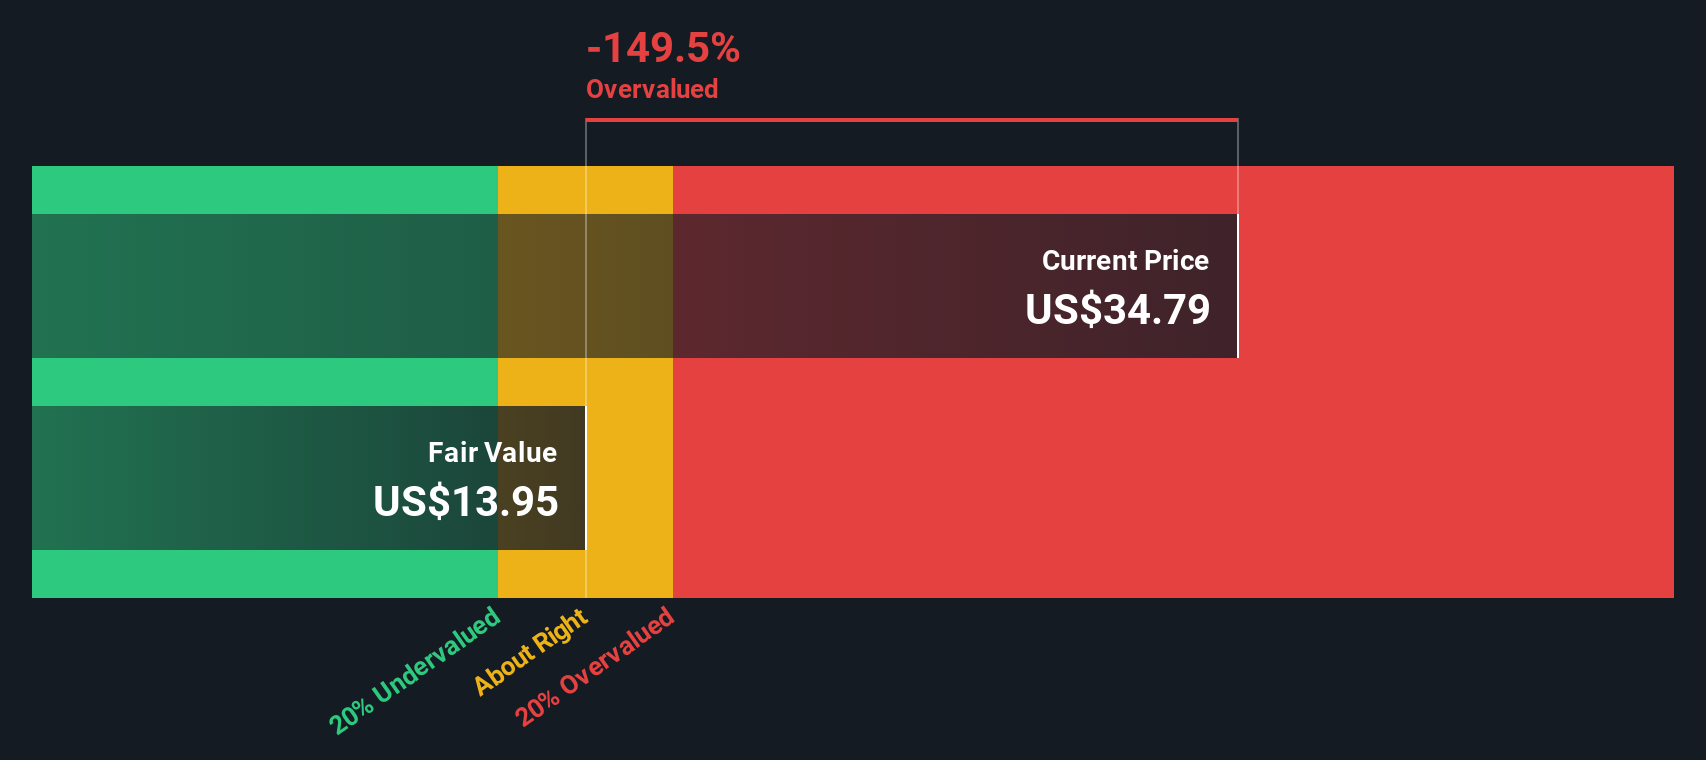
Using these projections, Simply Wall St arrives at an intrinsic value of $35.40 per share through the DCF model. Compared against the current share price, this implies Samsara is about 7.5% overvalued. Overall, the stock’s market value and its projected cash flows are in a fairly tight range.
Result: ABOUT RIGHT
Simply Wall St performs a valuation analysis on every stock in the world every day (check out Samsara's valuation analysis). We show the entire calculation in full. You can track the result in your watchlist or portfolio and be alerted when this changes.
Approach 2: Samsara Price vs Sales
For companies that are still scaling up profits or reinvesting heavily, the Price-to-Sales (P/S) ratio is a practical way to value the business. Unlike profit-based multiples, the P/S ratio helps investors gauge how much they are paying for each dollar of revenue. This is especially useful in high-growth sectors like software where earnings can be volatile or negative.
Growth potential and risk both play a role in what makes a P/S ratio “fair.” Typically, companies with rapid revenue expansion or a strong competitive edge justify a higher P/S ratio, while higher risk or slower growth should result in a lower multiple compared to the average.
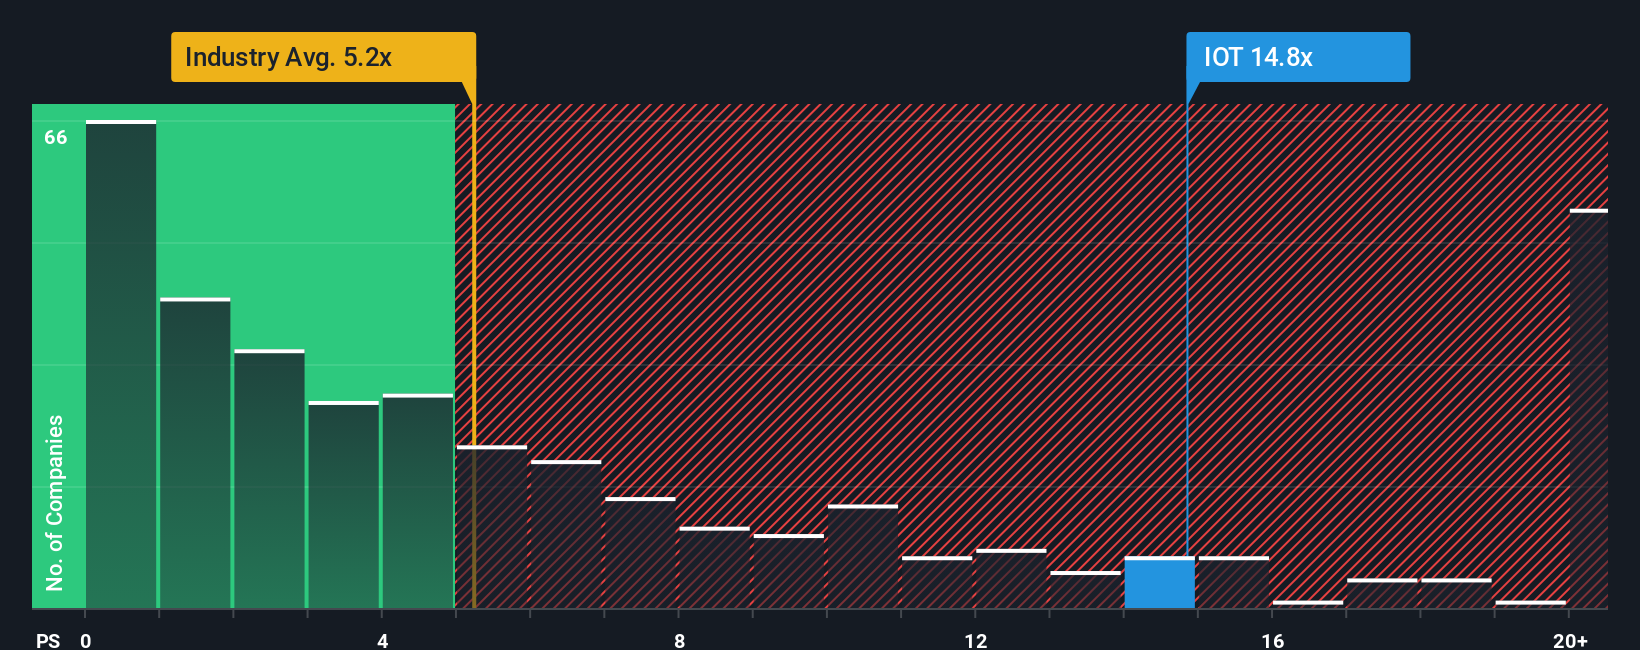
Samsara’s current P/S ratio stands at 15.3x. That is well above the software industry average of 5.2x and higher than the peer group average of 10.6x. However, Simply Wall St’s proprietary Fair Ratio for Samsara comes in at 11.3x. This Fair Ratio is tailored for Samsara, factoring in not just the industry and peers, but also company-specific traits like future growth outlook, profit margins, and unique risks. By synthesizing these elements, it offers a more holistic benchmark than generic industry multiples.
Comparing the current P/S ratio to the Fair Ratio, Samsara trades at a meaningful premium to its fundamentals. This suggests the market is expecting even stronger growth or is willing to pay up for quality, but strictly by the Fair Ratio standard, the stock appears overvalued at the moment.
Result: OVERVALUED
PS ratios tell one story, but what if the real opportunity lies elsewhere? Discover companies where insiders are betting big on explosive growth.
Upgrade Your Decision Making: Choose your Samsara Narrative
Earlier we mentioned that there is an even better way to interpret valuation. Let us introduce you to Narratives. Narratives are simply your personal story or viewpoint about a company, embodied in your own assumptions for its fair value and predictions for key metrics like revenue, earnings, and profit margins. By connecting the company’s journey to a projected financial outcome and then to what you believe is a fair price, Narratives translate numbers into meaningful investment perspectives.
On Simply Wall St, Narratives are designed to be intuitive so any investor can easily create and edit their own, or explore those built by millions of others on the Community page. With Narratives, you can see how your forecasted fair value compares to the current share price, helping guide clear decisions about when to buy or sell. In addition, Narratives update automatically as new data or news emerges, so your view always reflects the latest insights.
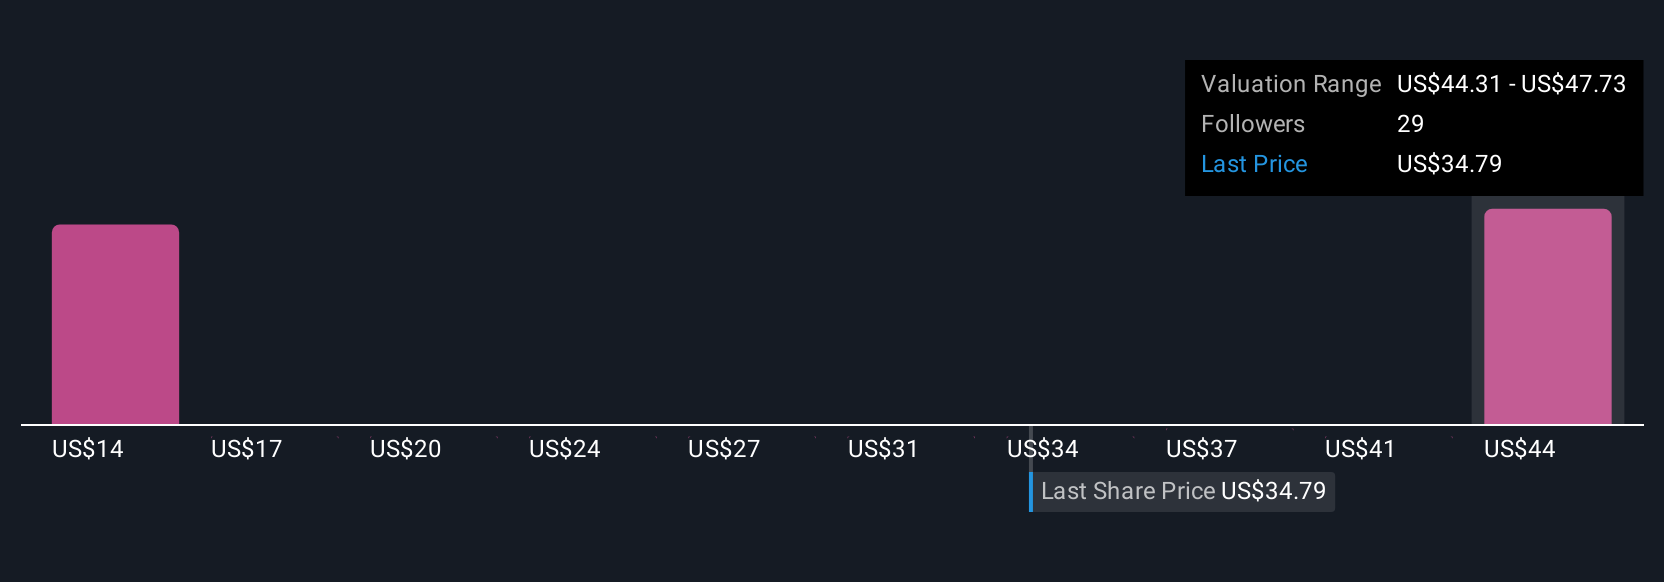
For example, looking at Samsara, some users currently see a future value as high as $60.00, optimistic about the company’s expansion and innovation. Others take a more cautious stance with a value as low as $38.00 due to competition and industry risks. Narratives make these perspectives visible and actionable, empowering you to invest with confidence and clarity.
Do you think there's more to the story for Samsara? Create your own Narrative to let the Community know!
This article by Simply Wall St is general in nature. We provide commentary based on historical data and analyst forecasts only using an unbiased methodology and our articles are not intended to be financial advice. It does not constitute a recommendation to buy or sell any stock, and does not take account of your objectives, or your financial situation. We aim to bring you long-term focused analysis driven by fundamental data. Note that our analysis may not factor in the latest price-sensitive company announcements or qualitative material. Simply Wall St has no position in any stocks mentioned.
New: Manage All Your Stock Portfolios in One Place
We've created the ultimate portfolio companion for stock investors, and it's free.
• Connect an unlimited number of Portfolios and see your total in one currency
• Be alerted to new Warning Signs or Risks via email or mobile
• Track the Fair Value of your stocks
Have feedback on this article? Concerned about the content? Get in touch with us directly. Alternatively, email editorial-team@simplywallst.com
About NYSE:IOT
Samsara
Provides solutions to connect physical operations data to its connected operations platform in the United States and internationally.
Flawless balance sheet with very low risk.
Similar Companies
Market Insights

Advertisement
Community Narratives
A formidable player in AI and enterprise computing.
Fair Value US$210.00|3.9% overvalued
CO
Community Contributor
IREN's Bold Moves in Sustainable Bitcoin Mining & AI Data Centers
Fair Value US$89.00|21.8% undervalued
BL
Community Contributor
Cooling the Champions: The Aussie Tech Behind F1's Victories
Fair Value AU$12.40|40.6% undervalued
TR
Community Contributor