Advertisement
- United States
- /
- Software
- /
- NYSE:ASAN
Analyzing Asana Stock After Strong Q1 Revenue Growth and Guidance Boost in 2025

Simply Wall St
Reviewed by Bailey Pemberton
If you’re wondering whether now is the right time to act on Asana stock, you’re not alone. There’s been a whirlwind of opinions swirling around this workplace management software company, especially among investors trying to make sense of its recent price swings. Over the past year, Asana has climbed an impressive 20.4%. The year-to-date number, however, sits deep in the red at -31.2%. Short-term moves have been quieter, with just a 0.4% gain in the past week and a 1.4% bump over the last month. Looking further back, the stock is still trying to recover from earlier setbacks, having dropped 38.5% over three years and 45.1% in five years.
Market-wide developments in the tech sector have fueled renewed hope in select growth stocks like Asana, with risk appetites gradually increasing as investors grow more comfortable with high-multiple names. That optimism hasn’t erased all wariness, but it has helped shift opinions on what fair value might actually mean for stocks in Asana’s category.
On the surface, Asana’s valuation seems compelling. The company scores a 5 out of 6 on our undervaluation checklist, which is a clear sign that, according to most major methods, it’s trading below what the fundamentals suggest it could be worth. But before you decide if this potential bargain is the real thing, let’s dig into how those valuation methods stack up and why numbers alone never tell the full story. There’s also one valuation insight worth waiting for at the end, which may offer the most important perspective for investors considering Asana right now.
Why Asana is lagging behind its peers
Approach 1: Asana Discounted Cash Flow (DCF) Analysis
The Discounted Cash Flow (DCF) model estimates the intrinsic value of a business by forecasting its future cash flows and then discounting those flows back to today’s terms. In Asana’s case, this method relies on projections of the company’s Free Cash Flow, which reflects how much cash Asana generates after all expenses and investments.
Currently, Asana reports Free Cash Flow of $33.5 million. Analysts anticipate significant growth, with projections reaching $189.8 million by 2028. These analyst estimates cover up to five years, and projections beyond that are extrapolated using industry trends. Looking a full decade ahead, forecasts suggest Asana’s Free Cash Flow could exceed $610 million by 2035. This highlights a strong potential runway for expansion.
Running these projections through the DCF model, Asana’s estimated intrinsic value lands at $29.22 per share. This is 53.3% higher than its present stock price, suggesting the market may be undervaluing the company based on future cash generation potential.
Result: UNDERVALUED
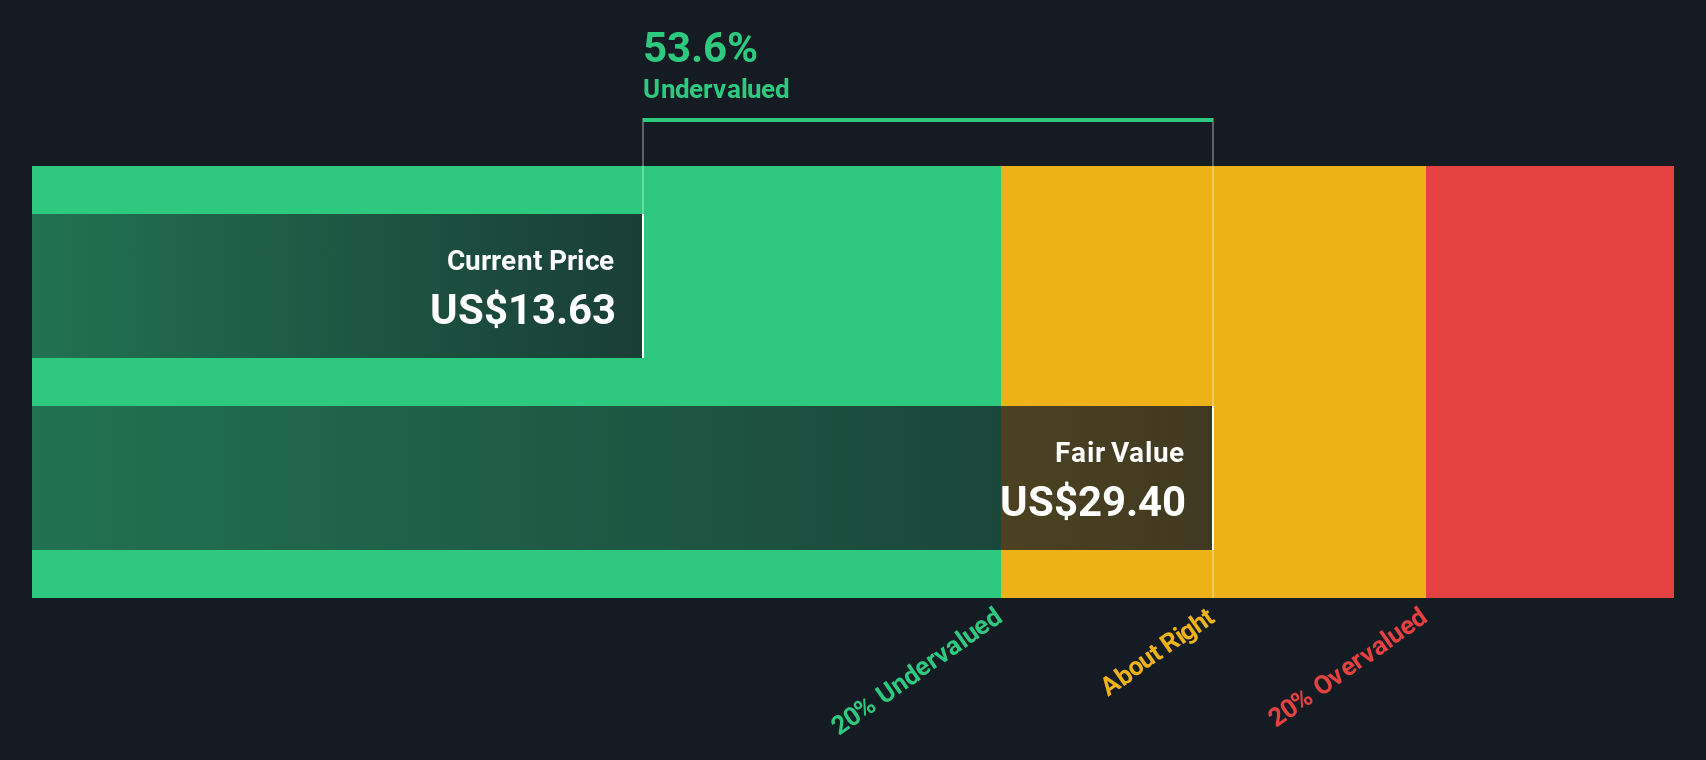
Our Discounted Cash Flow (DCF) analysis suggests Asana is undervalued by 53.3%. Track this in your watchlist or portfolio, or discover more undervalued stocks.
Approach 2: Asana Price vs Sales
For companies like Asana, which are still progressing toward sustained profitability, the Price-to-Sales (P/S) ratio is often the most telling valuation metric. Unlike the Price-to-Earnings (P/E) ratio, which becomes less reliable for unprofitable businesses, the P/S ratio focuses on how much investors are paying for each dollar of the company’s sales. This makes it especially relevant for high-growth, early-stage tech firms.
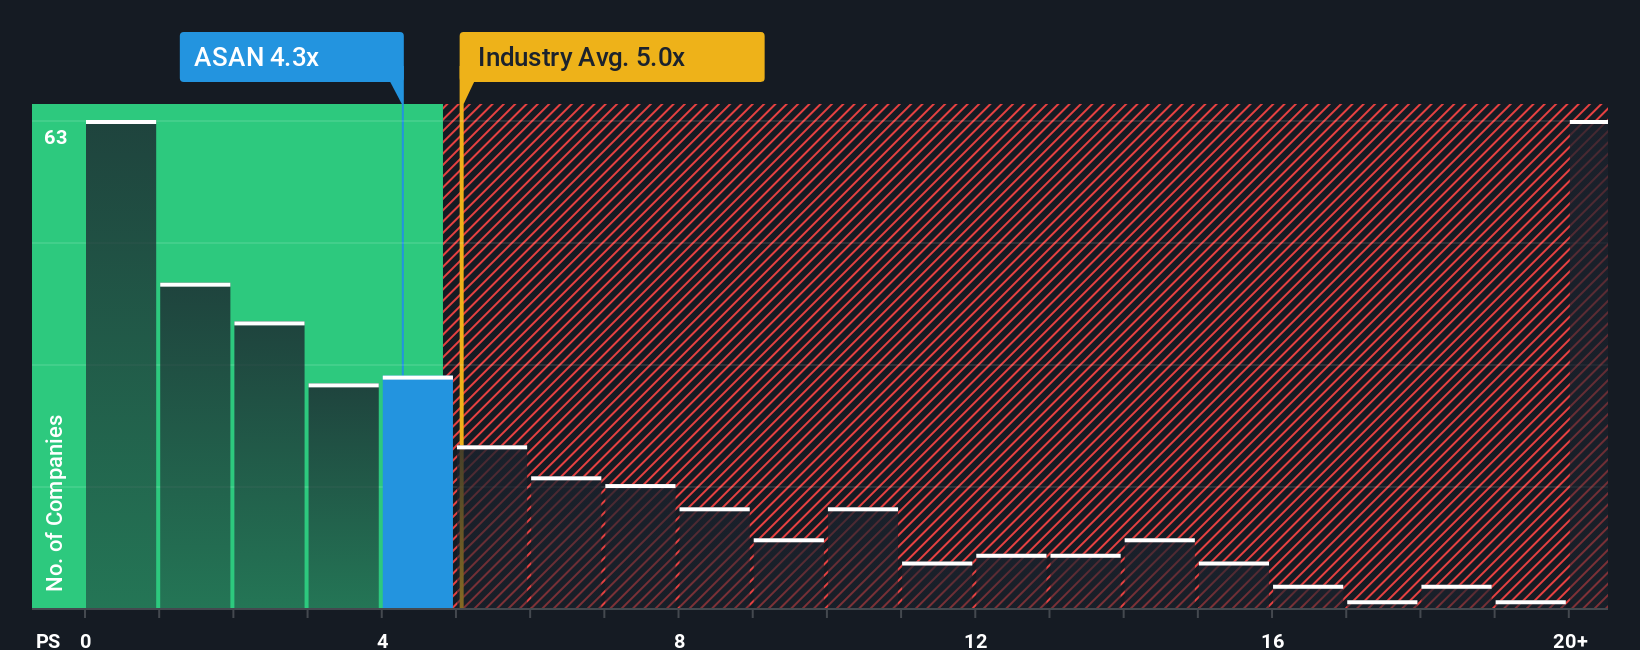
The "right" P/S ratio is not fixed and can shift based on a company’s growth prospects and perceived risks. Faster-growing companies and those with less risk tend to warrant a higher sales multiple, while more mature or riskier firms may see this number decline. For Asana, the current P/S ratio stands at 4.3x. That compares to the broader Software industry’s 5.3x and a peer group average of 5.7x. At first glance, this suggests the stock is trading at a discount relative to both peers and its sector.
Rather than relying purely on these broad benchmarks, it is more insightful to look at the “Fair Ratio,” which is Simply Wall St's proprietary metric. This custom multiple considers important factors such as Asana’s unique growth profile, industry position, profit margins, market cap, and risk factors. For Asana, the Fair Ratio is 6.6x. Because this is noticeably higher than the stock’s current 4.3x P/S, it indicates the market might not be fully recognizing the company’s future potential, even after accounting for relevant risks and sector trends.
Result: UNDERVALUED
PS ratios tell one story, but what if the real opportunity lies elsewhere? Discover companies where insiders are betting big on explosive growth.
Upgrade Your Decision Making: Choose your Asana Narrative
Earlier, we mentioned that there’s an even better way to understand valuation, so let’s introduce you to Narratives. Narratives are powerful, simple “stories behind the numbers” that empower you to frame your own perspective on a company’s future. You can combine your views about Asana’s growth, profitability, and margins into a financial forecast and a personalized fair value.
With Narratives, you connect the dots from Asana’s business journey to tangible financial outcomes and directly to actionable valuations. This approach offers an easy and accessible tool, found right on Simply Wall St’s Community page where millions of investors share their perspectives, to help you make buy or sell decisions by comparing your Fair Value to the current Price.
Unlike static reports, Narratives are updated dynamically when new information like news, earnings, or market events come in, so your view always reflects the latest developments.
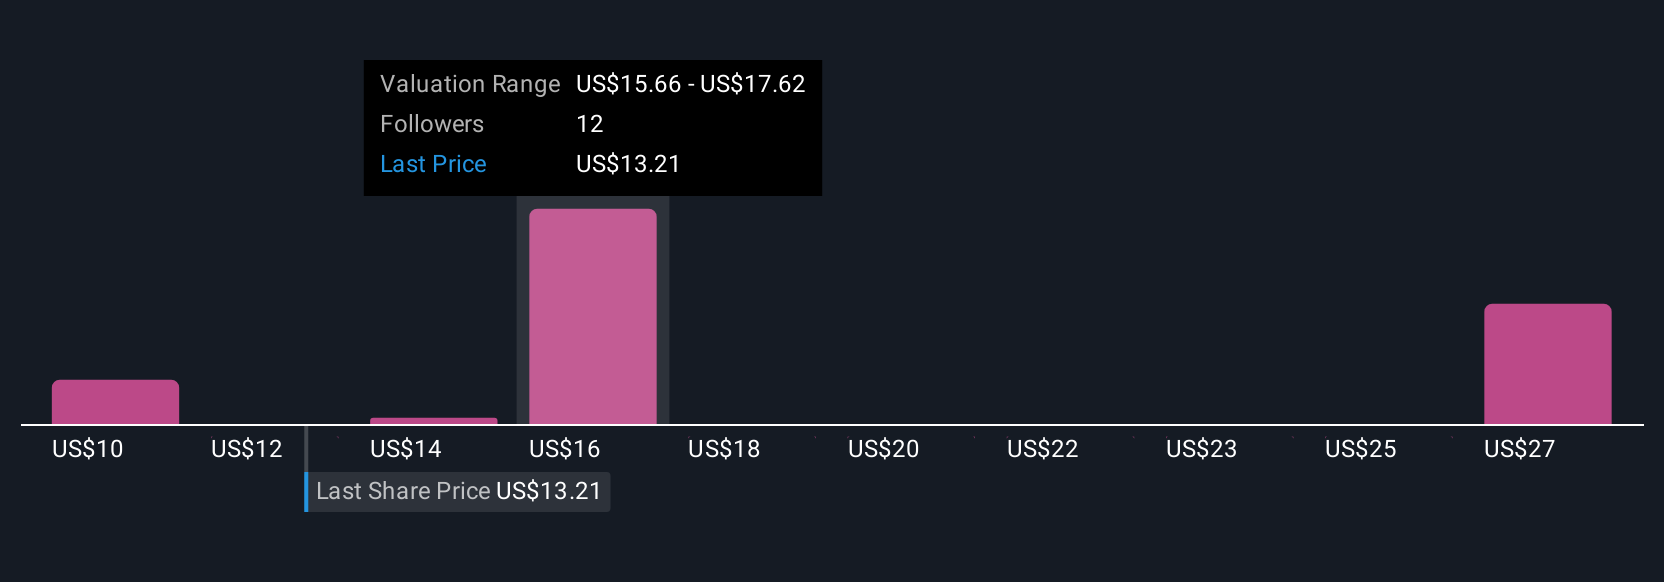
For example, some investors may build an optimistic Narrative for Asana, aiming for a $22.00 fair value based on strong AI-driven innovation and international growth. Others may strike a more cautious tone, setting their fair value closer to $10.00 given rising competition and regulatory risks. This empowers you to see both sides before making your own call.
Do you think there's more to the story for Asana? Create your own Narrative to let the Community know!
This article by Simply Wall St is general in nature. We provide commentary based on historical data and analyst forecasts only using an unbiased methodology and our articles are not intended to be financial advice. It does not constitute a recommendation to buy or sell any stock, and does not take account of your objectives, or your financial situation. We aim to bring you long-term focused analysis driven by fundamental data. Note that our analysis may not factor in the latest price-sensitive company announcements or qualitative material. Simply Wall St has no position in any stocks mentioned.
New: Manage All Your Stock Portfolios in One Place
We've created the ultimate portfolio companion for stock investors, and it's free.
• Connect an unlimited number of Portfolios and see your total in one currency
• Be alerted to new Warning Signs or Risks via email or mobile
• Track the Fair Value of your stocks
Have feedback on this article? Concerned about the content? Get in touch with us directly. Alternatively, email editorial-team@simplywallst.com
About NYSE:ASAN
Asana
Operates a work management software platform for individuals, team leads, and executives in the United States and internationally.
Flawless balance sheet and undervalued.
Similar Companies
Market Insights

Advertisement
Community Narratives
A formidable player in AI and enterprise computing.
Fair Value US$210.00|12.2% overvalued
CO
Community Contributor
IREN's Bold Moves in Sustainable Bitcoin Mining & AI Data Centers
Fair Value US$72.52|17.1% undervalued
BL
Community Contributor
Cooling the Champions: The Aussie Tech Behind F1's Victories
Fair Value AU$12.40|38.7% undervalued
TR
Community Contributor