

Some say volatility, rather than debt, is the best way to think about risk as an investor, but Warren Buffett famously said that 'Volatility is far from synonymous with risk.' When we think about how risky a company is, we always like to look at its use of debt, since debt overload can lead to ruin. As with many other companies Workday, Inc. (NASDAQ:WDAY) makes use of debt. But should shareholders be worried about its use of debt?
When Is Debt A Problem?
Debt assists a business until the business has trouble paying it off, either with new capital or with free cash flow. In the worst case scenario, a company can go bankrupt if it cannot pay its creditors. However, a more common (but still painful) scenario is that it has to raise new equity capital at a low price, thus permanently diluting shareholders. Of course, debt can be an important tool in businesses, particularly capital heavy businesses. When we examine debt levels, we first consider both cash and debt levels, together.
Check out our latest analysis for Workday
What Is Workday's Net Debt?
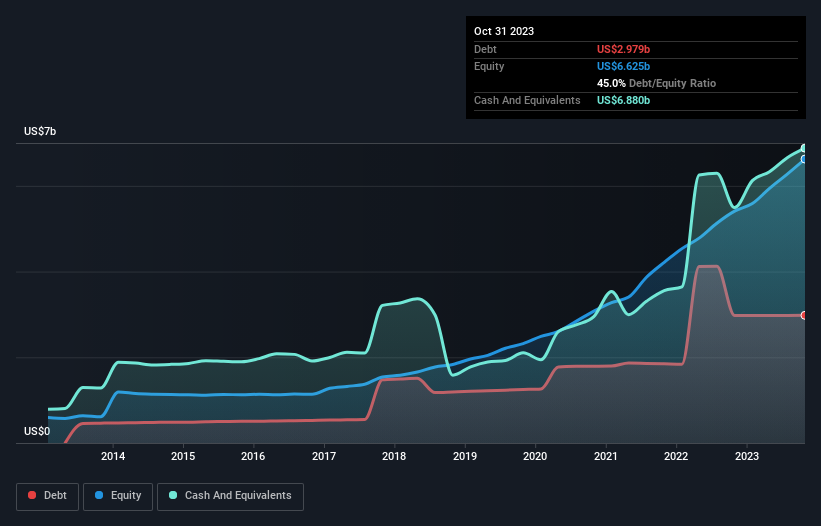
The chart below, which you can click on for greater detail, shows that Workday had US$2.98b in debt in October 2023; about the same as the year before. But it also has US$6.88b in cash to offset that, meaning it has US$3.90b net cash.
A Look At Workday's Liabilities
Zooming in on the latest balance sheet data, we can see that Workday had liabilities of US$4.03b due within 12 months and liabilities of US$3.27b due beyond that. Offsetting this, it had US$6.88b in cash and US$1.22b in receivables that were due within 12 months. So it actually has US$803.8m more liquid assets than total liabilities.
This state of affairs indicates that Workday's balance sheet looks quite solid, as its total liabilities are just about equal to its liquid assets. So it's very unlikely that the US$75.9b company is short on cash, but still worth keeping an eye on the balance sheet. Succinctly put, Workday boasts net cash, so it's fair to say it does not have a heavy debt load!
It was also good to see that despite losing money on the EBIT line last year, Workday turned things around in the last 12 months, delivering and EBIT of US$15m. When analysing debt levels, the balance sheet is the obvious place to start. But ultimately the future profitability of the business will decide if Workday can strengthen its balance sheet over time. So if you're focused on the future you can check out this free report showing analyst profit forecasts.
But our final consideration is also important, because a company cannot pay debt with paper profits; it needs cold hard cash. While Workday has net cash on its balance sheet, it's still worth taking a look at its ability to convert earnings before interest and tax (EBIT) to free cash flow, to help us understand how quickly it is building (or eroding) that cash balance. Happily for any shareholders, Workday actually produced more free cash flow than EBIT over the last year. That sort of strong cash generation warms our hearts like a puppy in a bumblebee suit.
Summing Up
While we empathize with investors who find debt concerning, you should keep in mind that Workday has net cash of US$3.90b, as well as more liquid assets than liabilities. And it impressed us with free cash flow of US$1.6b, being 10,310% of its EBIT. So is Workday's debt a risk? It doesn't seem so to us. When analysing debt levels, the balance sheet is the obvious place to start. However, not all investment risk resides within the balance sheet - far from it. To that end, you should be aware of the 2 warning signs we've spotted with Workday .
If you're interested in investing in businesses that can grow profits without the burden of debt, then check out this free list of growing businesses that have net cash on the balance sheet.
Valuation is complex, but we're here to simplify it.
Discover if Workday might be undervalued or overvalued with our detailed analysis, featuring fair value estimates, potential risks, dividends, insider trades, and its financial condition.
Access Free AnalysisHave feedback on this article? Concerned about the content? Get in touch with us directly. Alternatively, email editorial-team (at) simplywallst.com.
This article by Simply Wall St is general in nature. We provide commentary based on historical data and analyst forecasts only using an unbiased methodology and our articles are not intended to be financial advice. It does not constitute a recommendation to buy or sell any stock, and does not take account of your objectives, or your financial situation. We aim to bring you long-term focused analysis driven by fundamental data. Note that our analysis may not factor in the latest price-sensitive company announcements or qualitative material. Simply Wall St has no position in any stocks mentioned.
About NasdaqGS:WDAY
Workday
Provides enterprise cloud applications in the United States and internationally.
Flawless balance sheet with solid track record.
Similar Companies
Market Insights

Community Narratives
