- United States
- /
- Software
- /
- NasdaqGS:TENB
Health Check: How Prudently Does Tenable Holdings (NASDAQ:TENB) Use Debt?


Howard Marks put it nicely when he said that, rather than worrying about share price volatility, 'The possibility of permanent loss is the risk I worry about... and every practical investor I know worries about.' When we think about how risky a company is, we always like to look at its use of debt, since debt overload can lead to ruin. We note that Tenable Holdings, Inc. (NASDAQ:TENB) does have debt on its balance sheet. But should shareholders be worried about its use of debt?
When Is Debt Dangerous?
Generally speaking, debt only becomes a real problem when a company can't easily pay it off, either by raising capital or with its own cash flow. If things get really bad, the lenders can take control of the business. However, a more frequent (but still costly) occurrence is where a company must issue shares at bargain-basement prices, permanently diluting shareholders, just to shore up its balance sheet. Of course, plenty of companies use debt to fund growth, without any negative consequences. The first thing to do when considering how much debt a business uses is to look at its cash and debt together.
Check out the opportunities and risks within the US Software industry.
What Is Tenable Holdings's Net Debt?
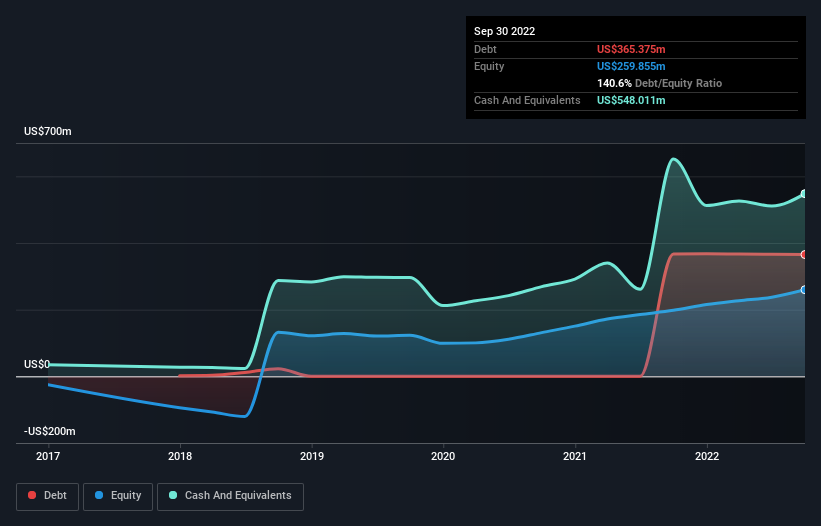
As you can see below, Tenable Holdings had US$365.4m of debt, at September 2022, which is about the same as the year before. You can click the chart for greater detail. However, it does have US$548.0m in cash offsetting this, leading to net cash of US$182.6m.
How Strong Is Tenable Holdings' Balance Sheet?
The latest balance sheet data shows that Tenable Holdings had liabilities of US$520.9m due within a year, and liabilities of US$568.9m falling due after that. On the other hand, it had cash of US$548.0m and US$147.9m worth of receivables due within a year. So it has liabilities totalling US$393.9m more than its cash and near-term receivables, combined.
Since publicly traded Tenable Holdings shares are worth a total of US$4.42b, it seems unlikely that this level of liabilities would be a major threat. But there are sufficient liabilities that we would certainly recommend shareholders continue to monitor the balance sheet, going forward. Despite its noteworthy liabilities, Tenable Holdings boasts net cash, so it's fair to say it does not have a heavy debt load! When analysing debt levels, the balance sheet is the obvious place to start. But ultimately the future profitability of the business will decide if Tenable Holdings can strengthen its balance sheet over time. So if you're focused on the future you can check out this free report showing analyst profit forecasts.
In the last year Tenable Holdings wasn't profitable at an EBIT level, but managed to grow its revenue by 27%, to US$648m. With any luck the company will be able to grow its way to profitability.
So How Risky Is Tenable Holdings?
While Tenable Holdings lost money on an earnings before interest and tax (EBIT) level, it actually generated positive free cash flow US$105m. So although it is loss-making, it doesn't seem to have too much near-term balance sheet risk, keeping in mind the net cash. One positive is that Tenable Holdings is growing revenue apace, which makes it easier to sell a growth story and raise capital if need be. But that doesn't change our opinion that the stock is risky. The balance sheet is clearly the area to focus on when you are analysing debt. However, not all investment risk resides within the balance sheet - far from it. To that end, you should be aware of the 3 warning signs we've spotted with Tenable Holdings .
At the end of the day, it's often better to focus on companies that are free from net debt. You can access our special list of such companies (all with a track record of profit growth). It's free.
If you're looking to trade Tenable Holdings, open an account with the lowest-cost platform trusted by professionals, Interactive Brokers.
With clients in over 200 countries and territories, and access to 160 markets, IBKR lets you trade stocks, options, futures, forex, bonds and funds from a single integrated account.
Enjoy no hidden fees, no account minimums, and FX conversion rates as low as 0.03%, far better than what most brokers offer.
Sponsored ContentValuation is complex, but we're here to simplify it.
Discover if Tenable Holdings might be undervalued or overvalued with our detailed analysis, featuring fair value estimates, potential risks, dividends, insider trades, and its financial condition.
Access Free AnalysisHave feedback on this article? Concerned about the content? Get in touch with us directly. Alternatively, email editorial-team (at) simplywallst.com.
This article by Simply Wall St is general in nature. We provide commentary based on historical data and analyst forecasts only using an unbiased methodology and our articles are not intended to be financial advice. It does not constitute a recommendation to buy or sell any stock, and does not take account of your objectives, or your financial situation. We aim to bring you long-term focused analysis driven by fundamental data. Note that our analysis may not factor in the latest price-sensitive company announcements or qualitative material. Simply Wall St has no position in any stocks mentioned.
About NasdaqGS:TENB
Tenable Holdings
Provides cyber exposure management solutions in the Americas, Europe, the Middle East, Africa, the Asia Pacific, and Japan.
Undervalued with excellent balance sheet.

