- United States
- /
- Software
- /
- NasdaqGS:ROP
Roper Technologies (NASDAQ:ROP) Has A Pretty Healthy Balance Sheet


Legendary fund manager Li Lu (who Charlie Munger backed) once said, 'The biggest investment risk is not the volatility of prices, but whether you will suffer a permanent loss of capital.' So it seems the smart money knows that debt - which is usually involved in bankruptcies - is a very important factor, when you assess how risky a company is. Importantly, Roper Technologies, Inc. (NASDAQ:ROP) does carry debt. But the real question is whether this debt is making the company risky.
What Risk Does Debt Bring?
Debt and other liabilities become risky for a business when it cannot easily fulfill those obligations, either with free cash flow or by raising capital at an attractive price. Ultimately, if the company can't fulfill its legal obligations to repay debt, shareholders could walk away with nothing. However, a more common (but still painful) scenario is that it has to raise new equity capital at a low price, thus permanently diluting shareholders. Having said that, the most common situation is where a company manages its debt reasonably well - and to its own advantage. The first thing to do when considering how much debt a business uses is to look at its cash and debt together.
See our latest analysis for Roper Technologies
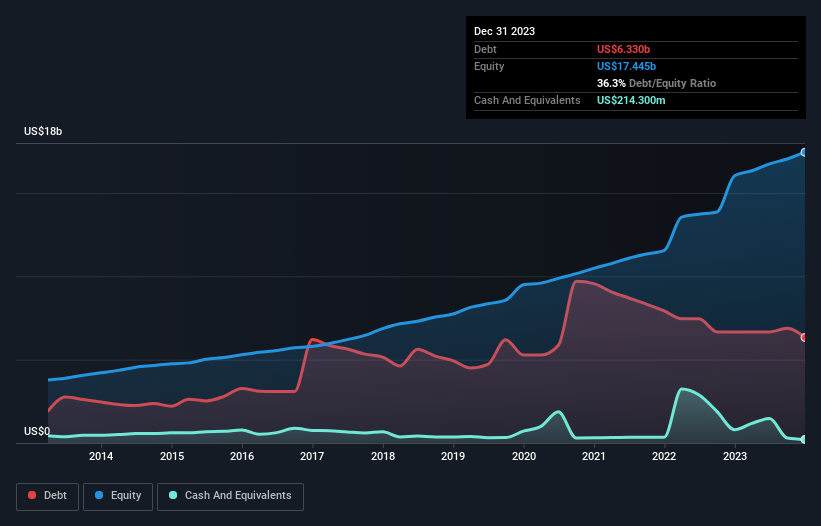
What Is Roper Technologies's Net Debt?
You can click the graphic below for the historical numbers, but it shows that Roper Technologies had US$6.33b of debt in December 2023, down from US$6.66b, one year before. On the flip side, it has US$214.3m in cash leading to net debt of about US$6.12b.
How Healthy Is Roper Technologies' Balance Sheet?
The latest balance sheet data shows that Roper Technologies had liabilities of US$2.96b due within a year, and liabilities of US$7.76b falling due after that. On the other hand, it had cash of US$214.3m and US$984.0m worth of receivables due within a year. So its liabilities outweigh the sum of its cash and (near-term) receivables by US$9.52b.
Given Roper Technologies has a humongous market capitalization of US$59.5b, it's hard to believe these liabilities pose much threat. Having said that, it's clear that we should continue to monitor its balance sheet, lest it change for the worse.
In order to size up a company's debt relative to its earnings, we calculate its net debt divided by its earnings before interest, tax, depreciation, and amortization (EBITDA) and its earnings before interest and tax (EBIT) divided by its interest expense (its interest cover). This way, we consider both the absolute quantum of the debt, as well as the interest rates paid on it.
Roper Technologies's net debt to EBITDA ratio of about 2.4 suggests only moderate use of debt. And its strong interest cover of 10.6 times, makes us even more comfortable. If Roper Technologies can keep growing EBIT at last year's rate of 14% over the last year, then it will find its debt load easier to manage. When analysing debt levels, the balance sheet is the obvious place to start. But ultimately the future profitability of the business will decide if Roper Technologies can strengthen its balance sheet over time. So if you want to see what the professionals think, you might find this free report on analyst profit forecasts to be interesting.
Finally, a business needs free cash flow to pay off debt; accounting profits just don't cut it. So the logical step is to look at the proportion of that EBIT that is matched by actual free cash flow. During the last three years, Roper Technologies generated free cash flow amounting to a very robust 99% of its EBIT, more than we'd expect. That positions it well to pay down debt if desirable to do so.
Our View
Happily, Roper Technologies's impressive conversion of EBIT to free cash flow implies it has the upper hand on its debt. But, on a more sombre note, we are a little concerned by its net debt to EBITDA. Zooming out, Roper Technologies seems to use debt quite reasonably; and that gets the nod from us. While debt does bring risk, when used wisely it can also bring a higher return on equity. Above most other metrics, we think its important to track how fast earnings per share is growing, if at all. If you've also come to that realization, you're in luck, because today you can view this interactive graph of Roper Technologies's earnings per share history for free.
At the end of the day, it's often better to focus on companies that are free from net debt. You can access our special list of such companies (all with a track record of profit growth). It's free.
New: AI Stock Screener & Alerts
Our new AI Stock Screener scans the market every day to uncover opportunities.
• Dividend Powerhouses (3%+ Yield)
• Undervalued Small Caps with Insider Buying
• High growth Tech and AI Companies
Or build your own from over 50 metrics.
Have feedback on this article? Concerned about the content? Get in touch with us directly. Alternatively, email editorial-team (at) simplywallst.com.
This article by Simply Wall St is general in nature. We provide commentary based on historical data and analyst forecasts only using an unbiased methodology and our articles are not intended to be financial advice. It does not constitute a recommendation to buy or sell any stock, and does not take account of your objectives, or your financial situation. We aim to bring you long-term focused analysis driven by fundamental data. Note that our analysis may not factor in the latest price-sensitive company announcements or qualitative material. Simply Wall St has no position in any stocks mentioned.
About NasdaqGS:ROP
Roper Technologies
Designs and develops software, and technology enabled products and solutions.
Adequate balance sheet and fair value.
Similar Companies
Market Insights

Community Narratives

