
Advertisement
- United States
- /
- Software
- /
- NasdaqGS:OTEX
Investors Met With Slowing Returns on Capital At Open Text (NASDAQ:OTEX)
If we want to find a stock that could multiply over the long term, what are the underlying trends we should look for? In a perfect world, we'd like to see a company investing more capital into its business and ideally the returns earned from that capital are also increasing. This shows us that it's a compounding machine, able to continually reinvest its earnings back into the business and generate higher returns. Having said that, from a first glance at Open Text (NASDAQ:OTEX) we aren't jumping out of our chairs at how returns are trending, but let's have a deeper look.
What Is Return On Capital Employed (ROCE)?
If you haven't worked with ROCE before, it measures the 'return' (pre-tax profit) a company generates from capital employed in its business. The formula for this calculation on Open Text is:
Return on Capital Employed = Earnings Before Interest and Tax (EBIT) ÷ (Total Assets - Current Liabilities)
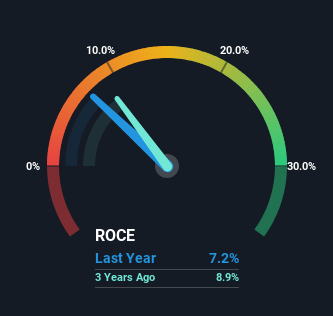
0.072 = US$966m ÷ (US$16b - US$3.0b) (Based on the trailing twelve months to March 2024).
Therefore, Open Text has an ROCE of 7.2%. On its own that's a low return on capital but it's in line with the industry's average returns of 7.4%.
View our latest analysis for Open Text
Above you can see how the current ROCE for Open Text compares to its prior returns on capital, but there's only so much you can tell from the past. If you'd like to see what analysts are forecasting going forward, you should check out our free analyst report for Open Text .
What Does the ROCE Trend For Open Text Tell Us?
In terms of Open Text's historical ROCE trend, it doesn't exactly demand attention. Over the past five years, ROCE has remained relatively flat at around 7.2% and the business has deployed 96% more capital into its operations. This poor ROCE doesn't inspire confidence right now, and with the increase in capital employed, it's evident that the business isn't deploying the funds into high return investments.
The Key Takeaway
As we've seen above, Open Text's returns on capital haven't increased but it is reinvesting in the business. Since the stock has declined 15% over the last five years, investors may not be too optimistic on this trend improving either. Therefore based on the analysis done in this article, we don't think Open Text has the makings of a multi-bagger.
If you'd like to know more about Open Text, we've spotted 5 warning signs, and 1 of them makes us a bit uncomfortable.
If you want to search for solid companies with great earnings, check out this free list of companies with good balance sheets and impressive returns on equity.
New: AI Stock Screener & Alerts
Our new AI Stock Screener scans the market every day to uncover opportunities.
• Dividend Powerhouses (3%+ Yield)
• Undervalued Small Caps with Insider Buying
• High growth Tech and AI Companies
Or build your own from over 50 metrics.
Have feedback on this article? Concerned about the content? Get in touch with us directly. Alternatively, email editorial-team (at) simplywallst.com.
This article by Simply Wall St is general in nature. We provide commentary based on historical data and analyst forecasts only using an unbiased methodology and our articles are not intended to be financial advice. It does not constitute a recommendation to buy or sell any stock, and does not take account of your objectives, or your financial situation. We aim to bring you long-term focused analysis driven by fundamental data. Note that our analysis may not factor in the latest price-sensitive company announcements or qualitative material. Simply Wall St has no position in any stocks mentioned.
About NasdaqGS:OTEX
Open Text
Designs, develops, markets, and sells information management software and solutions in North, Central, and South America, Europe, the Middle East, Africa, Australia, Japan, Singapore, India, and China.
Very undervalued established dividend payer.
Similar Companies
Market Insights

Advertisement
Weekly Picks
RO


RockeTeller on Santacruz Silver Mining ·
Crazy Undervalued 42 Baggers Silver Play (Active & Running Mine)
Fair Value:CA$8696.7% undervalued
71 followersusers have followed this narrative
7 commentsusers have commented on this narrative
20 likesusers have liked this narrative
RO


Robbo on Fiducian Group ·
Fiducian: Compliance Clouds or Value Opportunity?
Fair Value:AU$123.9% undervalued
11 followersusers have followed this narrative
0 commentsusers have commented on this narrative
0 likesusers have liked this narrative
WO

woodworthfund on Willamette Valley Vineyards ·
Willamette Valley Vineyards (WVVI): Not-So-Great Value
Fair Value:US$245.0% overvalued
11 followersusers have followed this narrative
0 commentsusers have commented on this narrative
1 likeusers have liked this narrative
Recently Updated Narratives
RE

RedhawkCC on Prime Medicine ·
PRME remains a long shot but publication in the New England Journal of Medicine helps.
Fair Value:US$0.0469.1k% overvalued
1 followerusers have followed this narrative
0 commentsusers have commented on this narrative
0 likesusers have liked this narrative
RA

RacerBVN on iShares Trust - iShares Preferred and Income Securities ETF ·
This one is all about the tax benefits
Fair Value:US$54.5543.4% undervalued
1 followerusers have followed this narrative
0 commentsusers have commented on this narrative
0 likesusers have liked this narrative
FA

FatPie on SoFi Technologies ·
Estimated Share Price is $79.54 using the Buffett Value Calculation
Fair Value:US$79.5465.3% undervalued
1 followerusers have followed this narrative
0 commentsusers have commented on this narrative
0 likesusers have liked this narrative
Popular Narratives
TH


TheWallstreetKing on MicroVision ·
MicroVision will explode future revenue by 380.37% with a vision towards success
Fair Value:US$6098.5% undervalued
118 followersusers have followed this narrative
11 commentsusers have commented on this narrative
22 likesusers have liked this narrative
AN


AnalystConsensusTarget on NVIDIA ·
NVDA: Expanding AI Demand Will Drive Major Data Center Investments Through 2026
Fair Value:US$250.3925.9% undervalued
961 followersusers have followed this narrative
6 commentsusers have commented on this narrative
25 likesusers have liked this narrative
RO
RockeTeller on Santacruz Silver Mining ·
Crazy Undervalued 42 Baggers Silver Play (Active & Running Mine)
Fair Value:CA$8696.7% undervalued
71 followersusers have followed this narrative
7 commentsusers have commented on this narrative
20 likesusers have liked this narrative
