Advertisement
- United States
- /
- Software
- /
- NasdaqGS:NBIS
What the 320% Surge Means for Nebius Group’s Current Share Price

Simply Wall St
Reviewed by Bailey Pemberton
Thinking about what to do with Nebius Group stock? You are not alone, especially when a company posts a jaw-dropping 320.0% year-to-date gain. For investors weighing the next move, the story here is anything but boring. Just last week, shares climbed another 8.9%, and if you zoom out to the last month, they are up more than 41.7%. Those numbers have everyone paying attention, whether you have been watching for a while or just heard the name for the first time.
What is behind all this momentum? Analysts point to recent market developments that have shifted investor sentiment, with more players seeing untapped potential or a change in how risks are calculated. If you have been eyeing Nebius Group’s long-term chart, the stock has more than doubled in the last five years, rising 128.3%. Clearly, something is at work here.
But does this rapid ascent mean the stock is undervalued, overvalued, or just fairly priced at its current close of 128.15? According to a straightforward snapshot of six common valuation checks, Nebius Group scores a 2, showing it is undervalued in only two areas. That is helpful, but as any seasoned investor will tell you, it does not capture the full story.
To really get a grip on whether Nebius Group is a hidden gem or a risky bet, we need to go deeper. Let’s walk through those valuation approaches and, at the end, I will share a way to see value that most people overlook.
Nebius Group scores just 2/6 on our valuation checks. See what other red flags we found in the full valuation breakdown.
Approach 1: Nebius Group Discounted Cash Flow (DCF) Analysis
The Discounted Cash Flow (DCF) model is a popular valuation technique that estimates a company’s intrinsic value by projecting its future cash flows and then discounting those projections back to today’s dollars. The goal is to determine what Nebius Group is truly worth based on its ability to generate cash over time, adjusted for the passage of time and risk.
For Nebius Group, the most recent twelve months resulted in a Free Cash Flow (FCF) of -$658.8 million. Analysts anticipate continued volatility in the years ahead, projecting negative cash flows through 2028, then shifting into positive territory by 2029 with a forecasted $767.1 million FCF and significant growth through 2035. The ten-year projection, combining analyst estimates and extrapolations, has free cash flow climbing to around $3.8 billion by 2035, a marked turnaround from the current deficits.
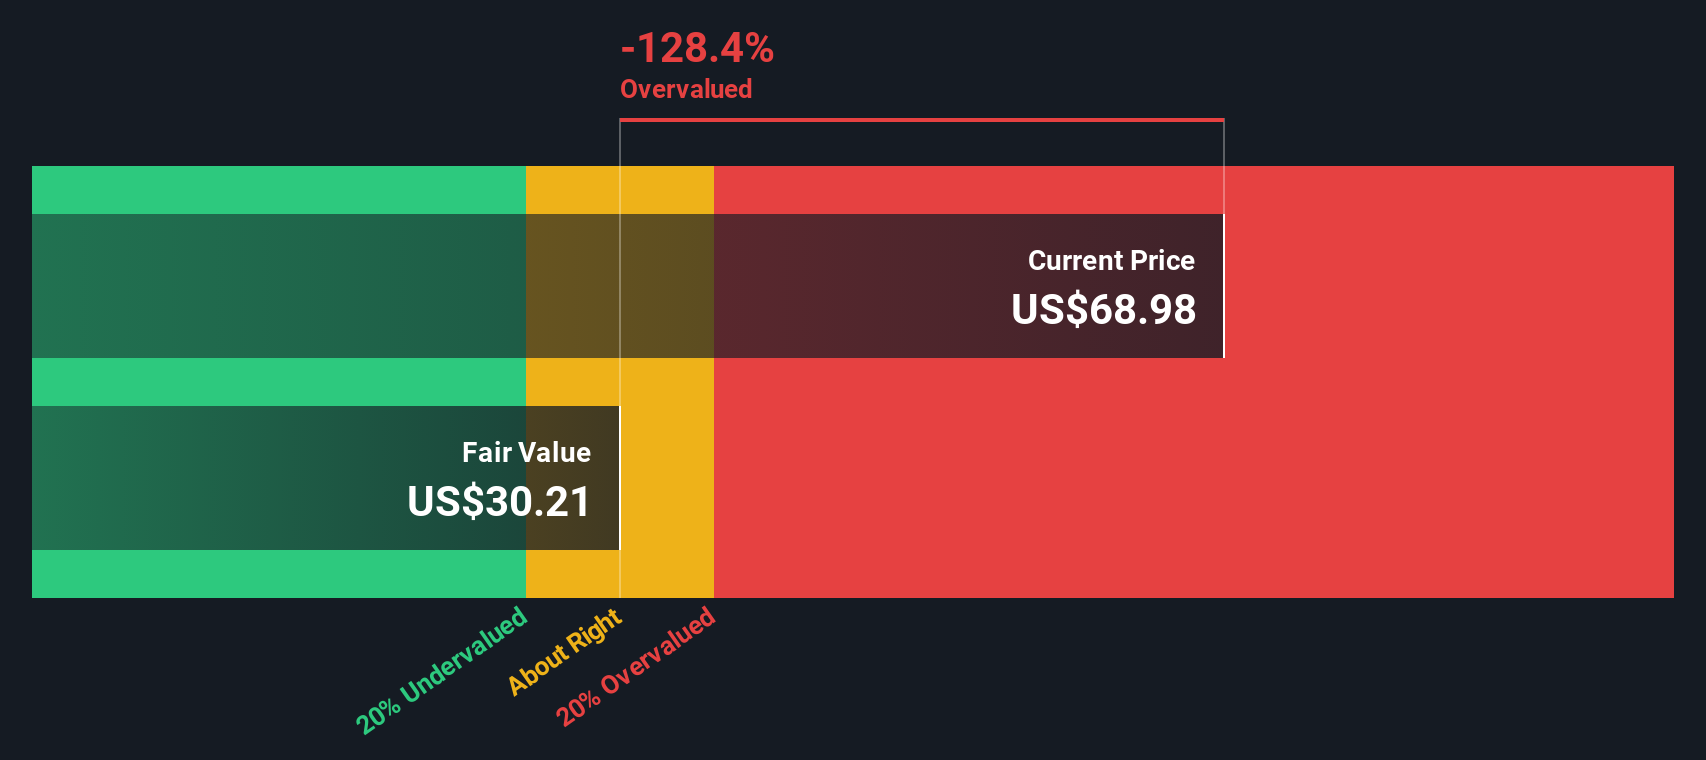
Based on these cash flows and using the two-stage Free Cash Flow to Equity model, the DCF analysis calculates Nebius Group’s fair value at $140.49 per share. With the current market price sitting at $128.15, the model suggests the stock is trading at an 8.8% discount to its intrinsic value. This indicates the shares are about right, neither sharply undervalued nor overpriced given reasonable projections and risk.
Result: ABOUT RIGHT
Simply Wall St performs a valuation analysis on every stock in the world every day (check out Nebius Group's valuation analysis). We show the entire calculation in full. You can track the result in your watchlist or portfolio and be alerted when this changes.
Approach 2: Nebius Group Price vs Book
Another popular way to value companies, especially in the software industry, is the price-to-book (P/B) ratio. This metric compares a company's market value to its net assets and is particularly useful for profitable businesses, as it reflects how much investors are willing to pay for each dollar of a company's net worth.
Growth expectations and risk both play a big role in what is considered a reasonable P/B ratio. Companies with robust growth outlooks and lower business risks usually command higher multiples, since investors foresee stronger returns and more predictable profits. On the other hand, if the market expects slower growth or higher risk, that fair multiple drops accordingly.
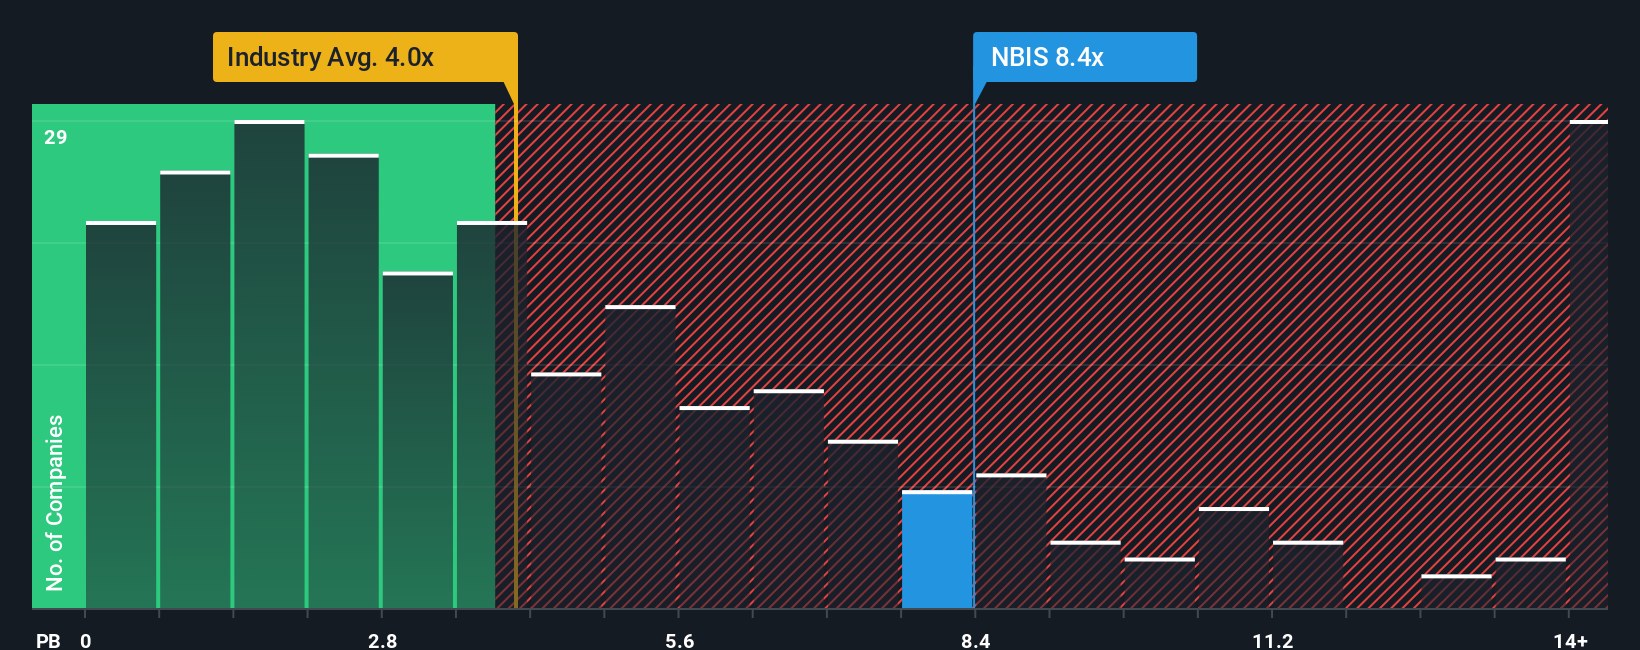
Nebius Group currently trades at a P/B ratio of 8.52x. For perspective, the software industry average sits at 4.10x, while its peer group averages 13.98x. This places Nebius Group above the industry mean but below the peer average, suggesting the market assigns it a middling valuation compared to similar companies.
This is where Simply Wall St's proprietary "Fair Ratio" comes into play. The Fair Ratio is designed to capture a company's unique position by factoring in its growth prospects, profit margins, market cap, and risk profile, along with industry context. This offers a more complete and tailored view than simple peer or industry comparisons.
Comparing Nebius Group’s actual P/B multiple to its Fair Ratio reveals they are quite close, indicating the stock trades in line with what you would expect based on its individual business profile and risk. There is no major mismatch between price and value here.
Result: ABOUT RIGHT
PB ratios tell one story, but what if the real opportunity lies elsewhere? Discover companies where insiders are betting big on explosive growth.
Upgrade Your Decision Making: Choose your Nebius Group Narrative
Earlier we mentioned that there is an even better way to understand valuation, so let’s introduce you to Narratives. A Narrative is simply your story behind the numbers: your own perspective and expectations about a company’s future prospects, captured as financial forecasts and a fair value estimate. Instead of relying solely on historical data or rigid valuation models, Narratives connect the company’s bigger picture and strategy to how those fundamentals might play out in the years ahead.
On Simply Wall St’s Community page, Narratives are easy to explore and create, giving you the tools that millions of investors already use to link their insights directly to their financial outlook. When you set or follow a Narrative, you can see at a glance how your chosen fair value compares to the current share price, helping you spot opportunities to buy, hold, or sell based on your own beliefs and assumptions.
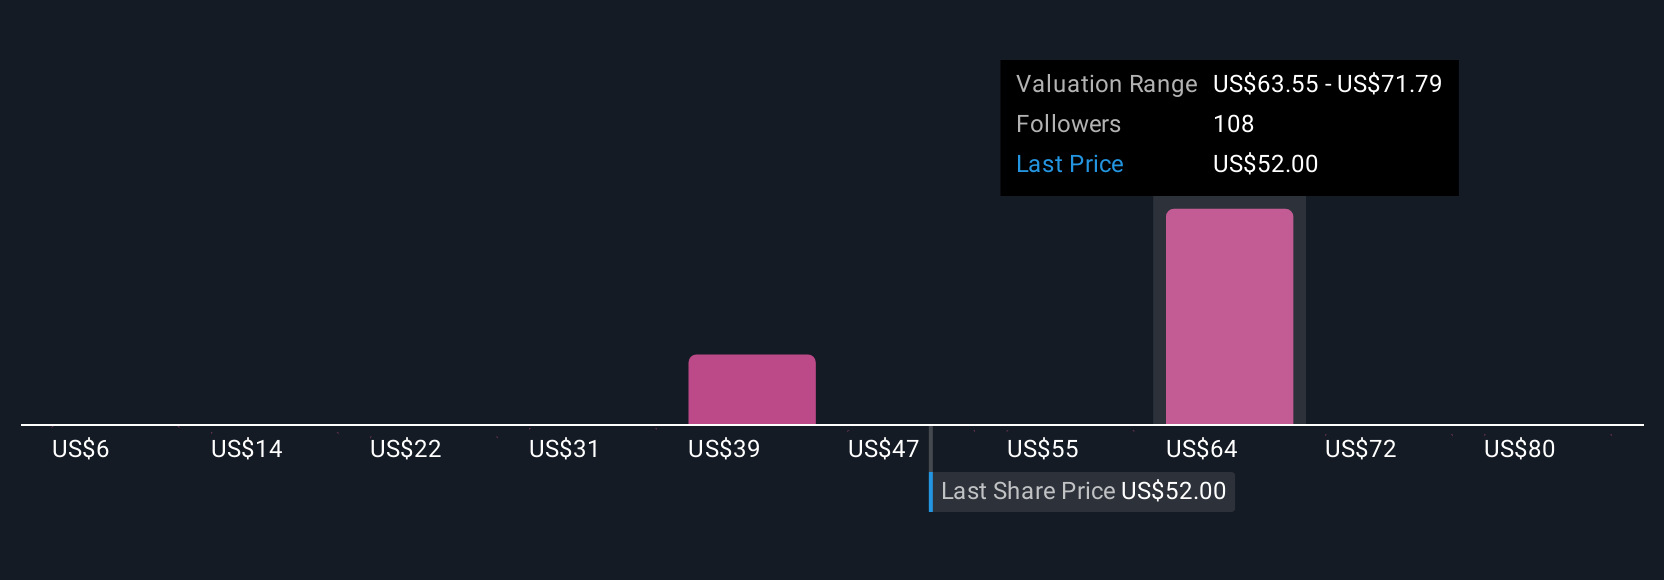
Best of all, Narratives update dynamically as new information comes in, such as company news, earnings, or industry changes, so your thinking stays current. For example, some Nebius Group investors set Narratives based on rapid AI adoption and expanding contracts, arriving at a fair value of $153 per share, while others see regulatory hurdles and changing margins and estimate fair value as low as $47. Both groups can refine their outlook as events unfold.
Do you think there's more to the story for Nebius Group? Create your own Narrative to let the Community know!
This article by Simply Wall St is general in nature. We provide commentary based on historical data and analyst forecasts only using an unbiased methodology and our articles are not intended to be financial advice. It does not constitute a recommendation to buy or sell any stock, and does not take account of your objectives, or your financial situation. We aim to bring you long-term focused analysis driven by fundamental data. Note that our analysis may not factor in the latest price-sensitive company announcements or qualitative material. Simply Wall St has no position in any stocks mentioned.
Valuation is complex, but we're here to simplify it.
Discover if Nebius Group might be undervalued or overvalued with our detailed analysis, featuring fair value estimates, potential risks, dividends, insider trades, and its financial condition.
Access Free AnalysisHave feedback on this article? Concerned about the content? Get in touch with us directly. Alternatively, email editorial-team@simplywallst.com
About NasdaqGS:NBIS
Nebius Group
A technology company, engages in building full-stack infrastructure to service the global AI industry in the Netherlands, Europe, North America, and Israel.
High growth potential with mediocre balance sheet.
Similar Companies
Market Insights

Advertisement
Community Narratives
A formidable player in AI and enterprise computing.
Fair Value US$210.00|3.9% overvalued
CO
Community Contributor
IREN's Bold Moves in Sustainable Bitcoin Mining & AI Data Centers
Fair Value US$89.00|21.8% undervalued
BL
Community Contributor
Cooling the Champions: The Aussie Tech Behind F1's Victories
Fair Value AU$12.40|40.6% undervalued
TR
Community Contributor