Advertisement
- United States
- /
- Software
- /
- NasdaqGS:NBIS
Is Nebius Group’s Rally Justified After Recent Software Sector Selloff?

Simply Wall St
Reviewed by Simply Wall St

If you own shares in Nebius Group, or you are considering adding NBIS to your portfolio, the question on everyone’s mind right now is: where does the stock go from here? Over the past three months, Nebius has delivered a whopping 72% return, and it is up more than 120% year-to-date. Of course, not all of the news has been positive. Just last week, NBIS dropped about 7%, likely due to shifting sentiment around software stocks as the market digested new industry guidance. Still, that dip did little to erase the momentum the company has built recently thanks to robust revenue growth (up 51% year-over-year) and solid net income gains.
But price movement only tells half the story. With the stock currently trading at $67.19 and analyst targets hovering near $89, investors are wondering if NBIS is undervalued or if the big run has gotten ahead of itself. According to one leading valuation model, Nebius Group scores a zero out of six for undervaluation checks. This is a clear sign that by standard measures, the stock does not look cheap at this level.
So, what does that actually mean for your decision-making? In the next section, we will break down the major ways analysts approach valuing a stock like Nebius. And stick around, because by the end, I will share a perspective on valuation you will not want to miss.
Nebius Group delivered 0.0% returns over the last year. See how this stacks up to the rest of the Software industry.Approach 1: Nebius Group Cash Flows
The Discounted Cash Flow (DCF) model estimates what a company is worth by projecting its future free cash flows and discounting those numbers back to today's value. In essence, it asks: if Nebius keeps generating cash at similar or better rates, what should those streams be worth right now?
Nebius Group’s latest twelve months Free Cash Flow stands at $239.25 million. Analysts expect this number to grow, with projections suggesting Free Cash Flow could reach $1.10 billion by 2035. This indicates substantial optimism for future growth. Over the next decade, the annual Free Cash Flow is forecast to turn positive after several years of losses, culminating in a steady upward trend.
When all these cash flows are tallied and discounted, the DCF model sets Nebius Group’s intrinsic value at just $30.06 per share. Compared to the current price of $67.19, that result points to the stock being 123.5% overvalued according to this method.
Result: OVERVALUED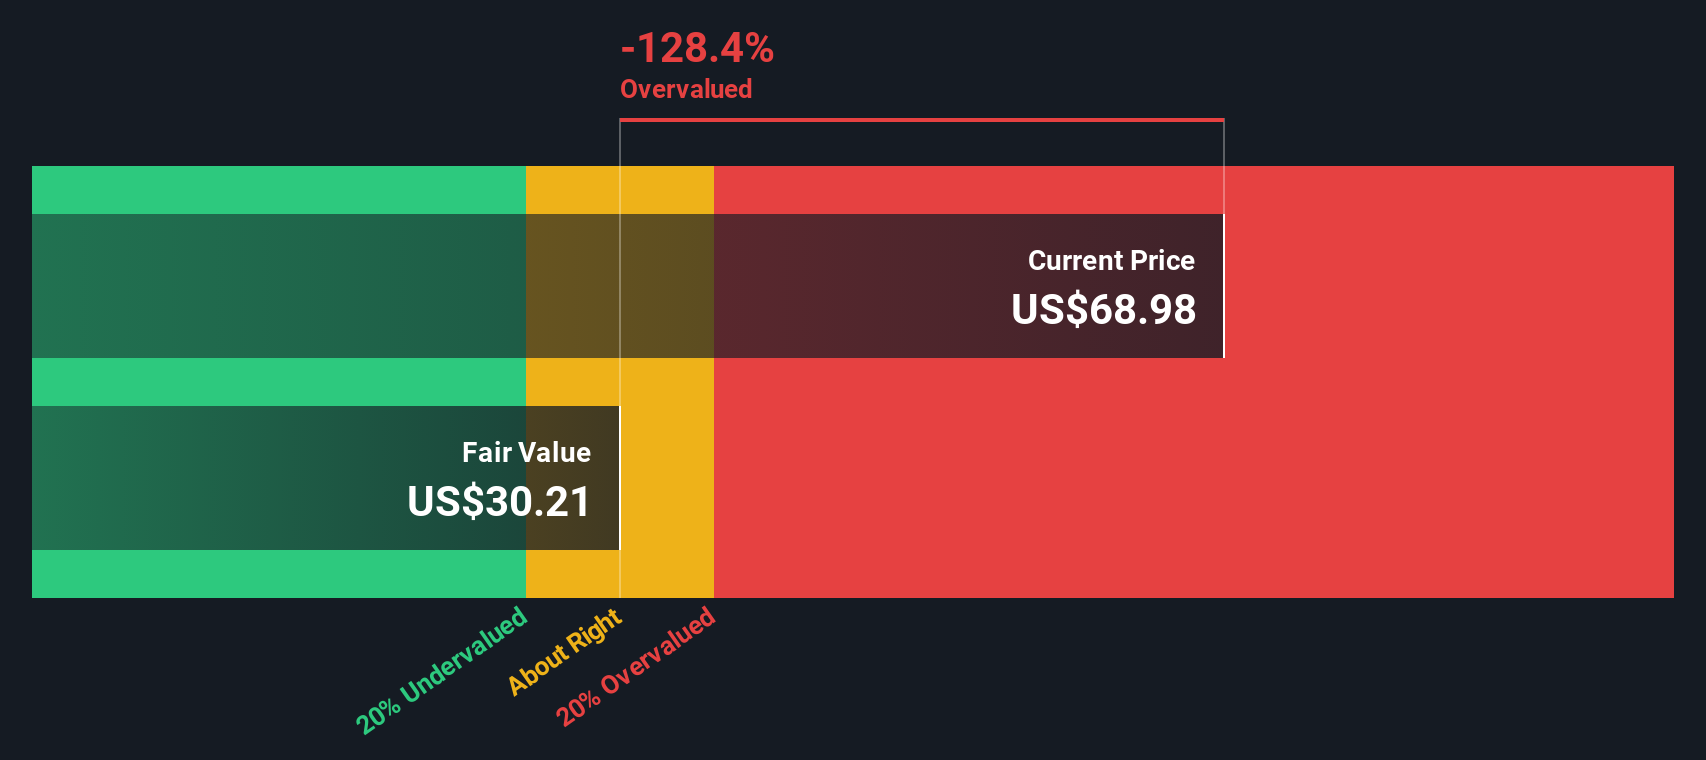
Approach 2: Nebius Group Price vs Earnings
The Price-to-Earnings (PE) ratio is a widely used valuation tool for profitable companies like Nebius Group. It shows how much investors are willing to pay for each dollar of current earnings, making it especially useful when the business generates consistent profits. PE ratios also reflect market expectations about future growth and perceived risk. A company with stronger growth prospects or lower risk typically commands a higher PE multiple than its peers.
Currently, Nebius Group is trading at a lofty PE ratio of 84.3x. This compares to the software industry's average of 36.5x and a peer group average of 44.8x, making NBIS look expensive at first glance. However, metrics like the PE ratio often need context. This is where the proprietary Fair Ratio comes in. The Fair Ratio estimates what Nebius Group’s PE should be, given unique factors such as its growth rate, margins, and industry dynamics. For NBIS, the Fair Ratio is calculated at 41.5x.
With the current PE nearly double the Fair Ratio, Nebius Group appears significantly overvalued using this approach. Barring rapid improvements in earnings or a shift in sentiment, investors may want to be cautious at these levels.
Result: OVERVALUED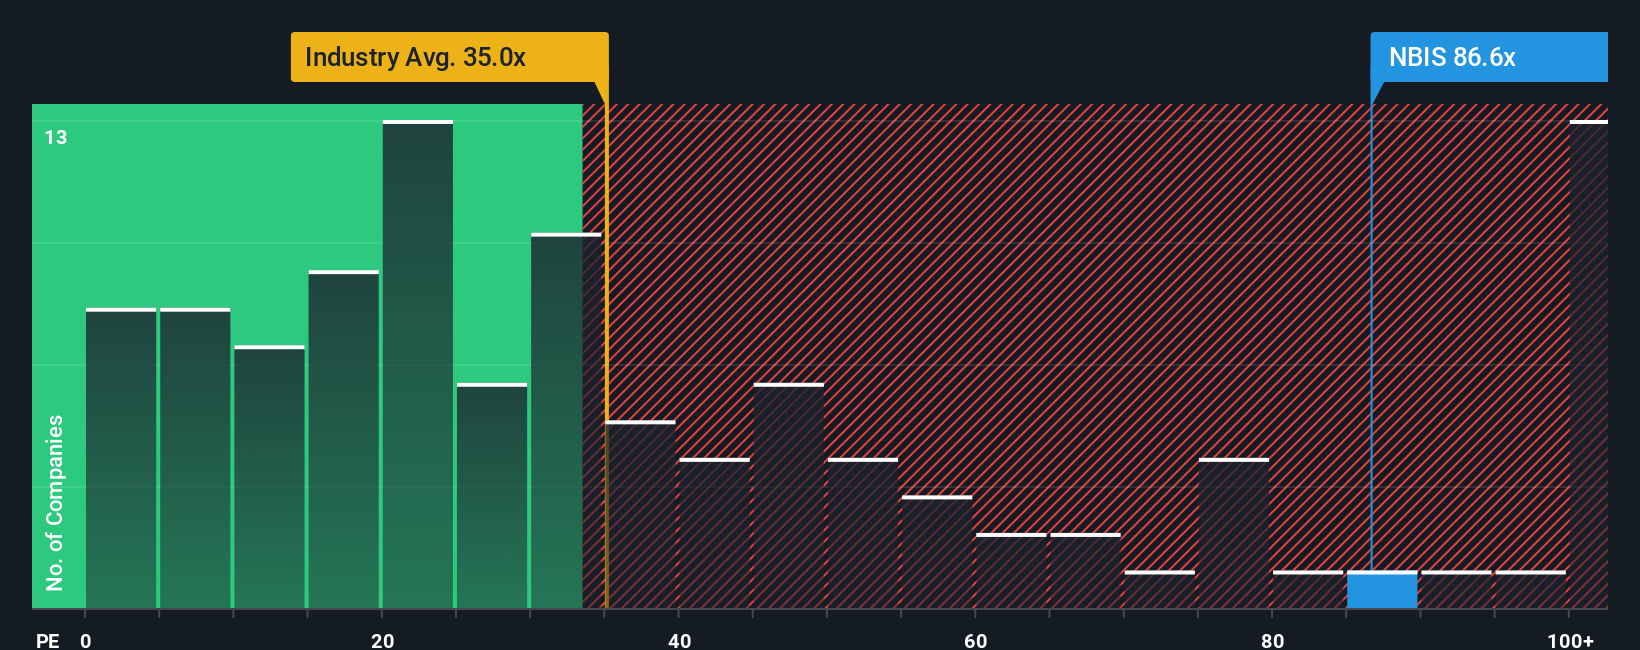
Upgrade Your Decision Making: Choose your Nebius Group Narrative
Narratives are a powerful way to guide your investing, letting you attach a story about the company's direction to the numbers you see, such as your own assumptions for fair value, revenue, earnings, and margins. Instead of just focusing on ratios or models, narratives connect Nebius Group’s business story (what you think will happen and why) to a specific financial forecast. This approach makes your investment decisions more personal and dynamic.
On the Simply Wall St platform, millions of investors use narratives to structure their thinking. You outline your version of the company’s future, see how that translates into fair value, and then compare it to the current price to decide if it is time to buy, hold, or sell. Narratives are automatically updated with new financials or news, so your view stays relevant as the story unfolds. For example, some investors might build an optimistic Nebius Group narrative with a $90 fair value based on rapidly growing global demand for AI, while others set a more cautious $47 target, citing intense competition and rising costs. Your decision involves not just the numbers, but also the story you believe in.
Do you think there's more to the story for Nebius Group? Create your own Narrative to let the Community know!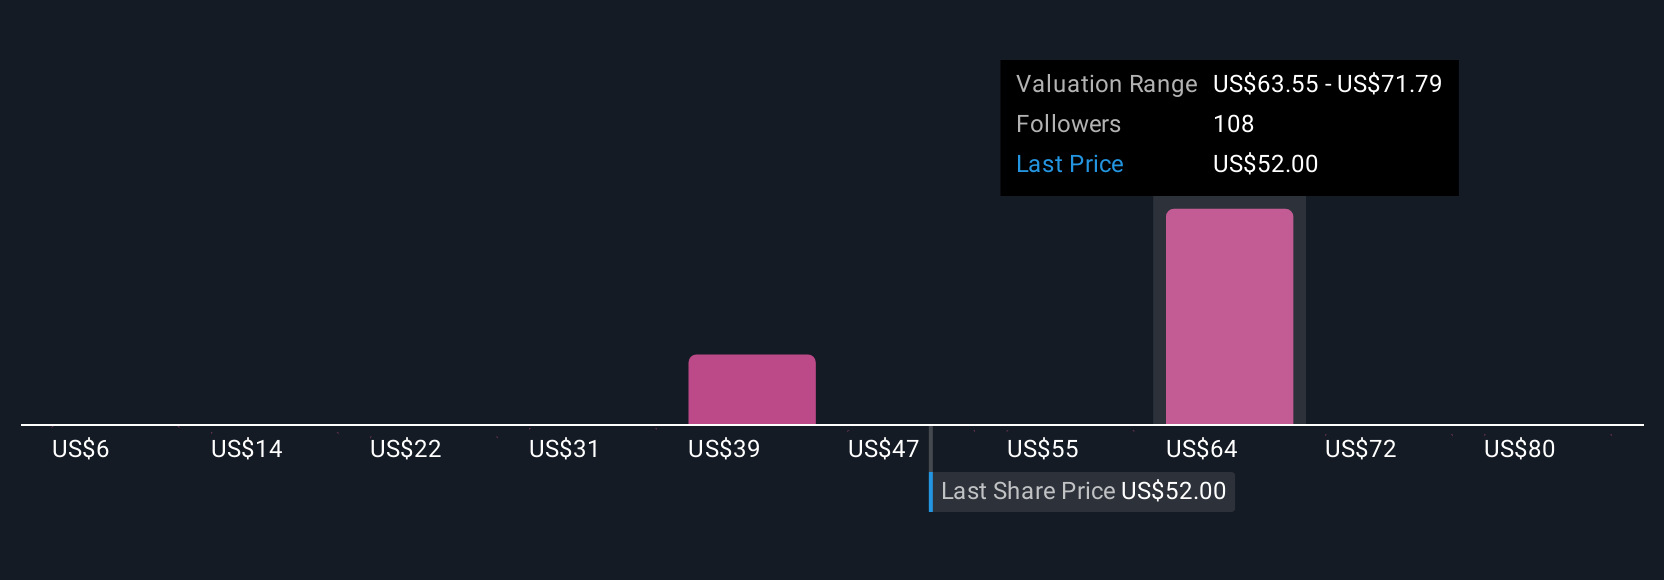
This article by Simply Wall St is general in nature. We provide commentary based on historical data and analyst forecasts only using an unbiased methodology and our articles are not intended to be financial advice. It does not constitute a recommendation to buy or sell any stock, and does not take account of your objectives, or your financial situation. We aim to bring you long-term focused analysis driven by fundamental data. Note that our analysis may not factor in the latest price-sensitive company announcements or qualitative material. Simply Wall St has no position in any stocks mentioned.
Valuation is complex, but we're here to simplify it.
Discover if Nebius Group might be undervalued or overvalued with our detailed analysis, featuring fair value estimates, potential risks, dividends, insider trades, and its financial condition.
Access Free AnalysisHave feedback on this article? Concerned about the content? Get in touch with us directly. Alternatively, email editorial-team@simplywallst.com
About NasdaqGS:NBIS
Nebius Group
A technology company, engages in building full-stack infrastructure to service the global AI industry in the Netherlands, Europe, North America, and Israel.
Reasonable growth potential with adequate balance sheet.
Similar Companies
Market Insights


Advertisement
Community Narratives
Gaxos.ai: Early-Stage AI Innovator in Gaming & Health
Fair Value US$2.21|17.6% undervalued
JO
Community Contributor
After the AI Party: A Sobering Look at Microsoft's Future
Fair Value US$500.00|1.1% overvalued
PI
Community Contributor
Amazon's Future Rises as Stock Price Falls: A Long-Term Investment Vision
Fair Value US$234.75|4.7% undervalued
ZW
Community Contributor
