- United States
- /
- Software
- /
- NasdaqGS:MNDY
Does This Valuation Of monday.com Ltd. (NASDAQ:MNDY) Imply Investors Are Overpaying?


Key Insights
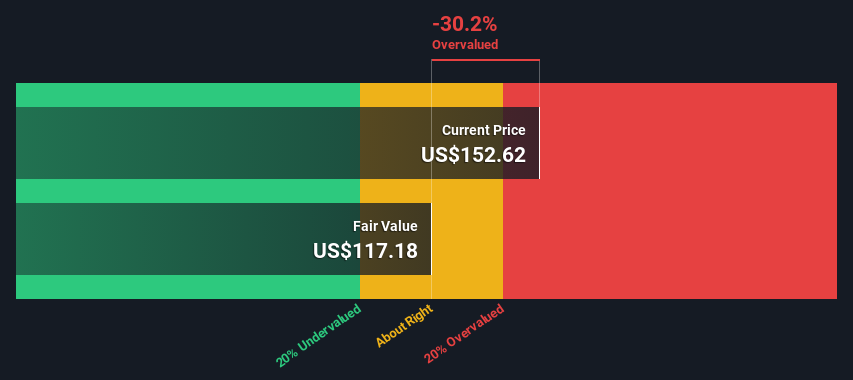
- Using the 2 Stage Free Cash Flow to Equity, monday.com fair value estimate is US$117
- monday.com's US$153 share price signals that it might be 30% overvalued
- The US$207 analyst price target for MNDY is 77% more than our estimate of fair value
Does the October share price for monday.com Ltd. (NASDAQ:MNDY) reflect what it's really worth? Today, we will estimate the stock's intrinsic value by taking the expected future cash flows and discounting them to today's value. We will use the Discounted Cash Flow (DCF) model on this occasion. Before you think you won't be able to understand it, just read on! It's actually much less complex than you'd imagine.
Remember though, that there are many ways to estimate a company's value, and a DCF is just one method. If you want to learn more about discounted cash flow, the rationale behind this calculation can be read in detail in the Simply Wall St analysis model.
Check out our latest analysis for monday.com
The Model
We're using the 2-stage growth model, which simply means we take in account two stages of company's growth. In the initial period the company may have a higher growth rate and the second stage is usually assumed to have a stable growth rate. To begin with, we have to get estimates of the next ten years of cash flows. Where possible we use analyst estimates, but when these aren't available we extrapolate the previous free cash flow (FCF) from the last estimate or reported value. We assume companies with shrinking free cash flow will slow their rate of shrinkage, and that companies with growing free cash flow will see their growth rate slow, over this period. We do this to reflect that growth tends to slow more in the early years than it does in later years.
A DCF is all about the idea that a dollar in the future is less valuable than a dollar today, and so the sum of these future cash flows is then discounted to today's value:
10-year free cash flow (FCF) estimate
| 2024 | 2025 | 2026 | 2027 | 2028 | 2029 | 2030 | 2031 | 2032 | 2033 | |
| Levered FCF ($, Millions) | US$145.0m | US$229.0m | US$273.8m | US$313.0m | US$346.4m | US$374.6m | US$398.3m | US$418.5m | US$436.0m | US$451.7m |
| Growth Rate Estimate Source | Analyst x8 | Analyst x1 | Est @ 19.55% | Est @ 14.33% | Est @ 10.68% | Est @ 8.12% | Est @ 6.33% | Est @ 5.07% | Est @ 4.20% | Est @ 3.58% |
| Present Value ($, Millions) Discounted @ 8.1% | US$134 | US$196 | US$217 | US$229 | US$234 | US$234 | US$231 | US$224 | US$216 | US$207 |
("Est" = FCF growth rate estimated by Simply Wall St)
Present Value of 10-year Cash Flow (PVCF) = US$2.1b
After calculating the present value of future cash flows in the initial 10-year period, we need to calculate the Terminal Value, which accounts for all future cash flows beyond the first stage. The Gordon Growth formula is used to calculate Terminal Value at a future annual growth rate equal to the 5-year average of the 10-year government bond yield of 2.2%. We discount the terminal cash flows to today's value at a cost of equity of 8.1%.
Terminal Value (TV)= FCF2033 × (1 + g) ÷ (r – g) = US$452m× (1 + 2.2%) ÷ (8.1%– 2.2%) = US$7.7b
Present Value of Terminal Value (PVTV)= TV / (1 + r)10= US$7.7b÷ ( 1 + 8.1%)10= US$3.5b
The total value, or equity value, is then the sum of the present value of the future cash flows, which in this case is US$5.7b. In the final step we divide the equity value by the number of shares outstanding. Compared to the current share price of US$153, the company appears potentially overvalued at the time of writing. The assumptions in any calculation have a big impact on the valuation, so it is better to view this as a rough estimate, not precise down to the last cent.
The Assumptions
We would point out that the most important inputs to a discounted cash flow are the discount rate and of course the actual cash flows. If you don't agree with these result, have a go at the calculation yourself and play with the assumptions. The DCF also does not consider the possible cyclicality of an industry, or a company's future capital requirements, so it does not give a full picture of a company's potential performance. Given that we are looking at monday.com as potential shareholders, the cost of equity is used as the discount rate, rather than the cost of capital (or weighted average cost of capital, WACC) which accounts for debt. In this calculation we've used 8.1%, which is based on a levered beta of 0.984. Beta is a measure of a stock's volatility, compared to the market as a whole. We get our beta from the industry average beta of globally comparable companies, with an imposed limit between 0.8 and 2.0, which is a reasonable range for a stable business.
SWOT Analysis for monday.com
- Currently debt free.
- Expensive based on P/S ratio and estimated fair value.
- Shareholders have been diluted in the past year.
- Has sufficient cash runway for more than 3 years based on current free cash flows.
- Not expected to become profitable over the next 3 years.
Moving On:
Valuation is only one side of the coin in terms of building your investment thesis, and it ideally won't be the sole piece of analysis you scrutinize for a company. DCF models are not the be-all and end-all of investment valuation. Rather it should be seen as a guide to "what assumptions need to be true for this stock to be under/overvalued?" If a company grows at a different rate, or if its cost of equity or risk free rate changes sharply, the output can look very different. Why is the intrinsic value lower than the current share price? For monday.com, there are three important items you should further research:
- Risks: For instance, we've identified 3 warning signs for monday.com (1 is significant) you should be aware of.
- Future Earnings: How does MNDY's growth rate compare to its peers and the wider market? Dig deeper into the analyst consensus number for the upcoming years by interacting with our free analyst growth expectation chart.
- Other Solid Businesses: Low debt, high returns on equity and good past performance are fundamental to a strong business. Why not explore our interactive list of stocks with solid business fundamentals to see if there are other companies you may not have considered!
PS. Simply Wall St updates its DCF calculation for every American stock every day, so if you want to find the intrinsic value of any other stock just search here.
New: AI Stock Screener & Alerts
Our new AI Stock Screener scans the market every day to uncover opportunities.
• Dividend Powerhouses (3%+ Yield)
• Undervalued Small Caps with Insider Buying
• High growth Tech and AI Companies
Or build your own from over 50 metrics.
Have feedback on this article? Concerned about the content? Get in touch with us directly. Alternatively, email editorial-team (at) simplywallst.com.
This article by Simply Wall St is general in nature. We provide commentary based on historical data and analyst forecasts only using an unbiased methodology and our articles are not intended to be financial advice. It does not constitute a recommendation to buy or sell any stock, and does not take account of your objectives, or your financial situation. We aim to bring you long-term focused analysis driven by fundamental data. Note that our analysis may not factor in the latest price-sensitive company announcements or qualitative material. Simply Wall St has no position in any stocks mentioned.
About NasdaqGS:MNDY
monday.com
Develops software applications in the United States, Europe, the Middle East, Africa, the United Kingdom, and internationally.
Flawless balance sheet and good value.
