- United States
- /
- Diversified Financial
- /
- NasdaqGS:JKHY
Jack Henry & Associates (NASDAQ:JKHY) shareholders have earned a 8.7% CAGR over the last five years


It hasn't been the best quarter for Jack Henry & Associates, Inc. (NASDAQ:JKHY) shareholders, since the share price has fallen 11% in that time. On the bright side the share price is up over the last half decade. However we are not very impressed because the share price is only up 44%, less than the market return of 53%.
Now it's worth having a look at the company's fundamentals too, because that will help us determine if the long term shareholder return has matched the performance of the underlying business.
Check out our latest analysis for Jack Henry & Associates
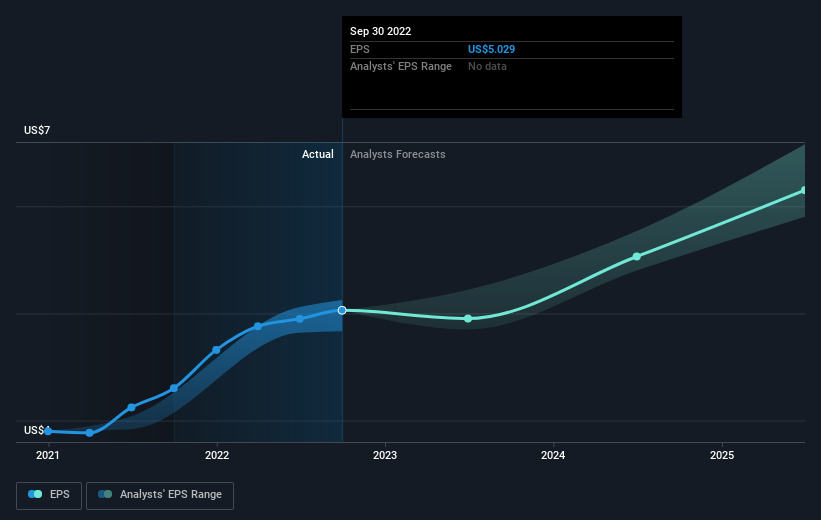
There is no denying that markets are sometimes efficient, but prices do not always reflect underlying business performance. One imperfect but simple way to consider how the market perception of a company has shifted is to compare the change in the earnings per share (EPS) with the share price movement.
During five years of share price growth, Jack Henry & Associates achieved compound earnings per share (EPS) growth of 9.3% per year. The EPS growth is more impressive than the yearly share price gain of 7% over the same period. So one could conclude that the broader market has become more cautious towards the stock.
The graphic below depicts how EPS has changed over time (unveil the exact values by clicking on the image).
We know that Jack Henry & Associates has improved its bottom line lately, but is it going to grow revenue? You could check out this free report showing analyst revenue forecasts.
What About Dividends?
When looking at investment returns, it is important to consider the difference between total shareholder return (TSR) and share price return. The TSR is a return calculation that accounts for the value of cash dividends (assuming that any dividend received was reinvested) and the calculated value of any discounted capital raisings and spin-offs. Arguably, the TSR gives a more comprehensive picture of the return generated by a stock. In the case of Jack Henry & Associates, it has a TSR of 52% for the last 5 years. That exceeds its share price return that we previously mentioned. And there's no prize for guessing that the dividend payments largely explain the divergence!
A Different Perspective
It's good to see that Jack Henry & Associates has rewarded shareholders with a total shareholder return of 15% in the last twelve months. That's including the dividend. That gain is better than the annual TSR over five years, which is 9%. Therefore it seems like sentiment around the company has been positive lately. Given the share price momentum remains strong, it might be worth taking a closer look at the stock, lest you miss an opportunity. While it is well worth considering the different impacts that market conditions can have on the share price, there are other factors that are even more important. For instance, we've identified 1 warning sign for Jack Henry & Associates that you should be aware of.
If you like to buy stocks alongside management, then you might just love this free list of companies. (Hint: insiders have been buying them).
Please note, the market returns quoted in this article reflect the market weighted average returns of stocks that currently trade on US exchanges.
New: Manage All Your Stock Portfolios in One Place
We've created the ultimate portfolio companion for stock investors, and it's free.
• Connect an unlimited number of Portfolios and see your total in one currency
• Be alerted to new Warning Signs or Risks via email or mobile
• Track the Fair Value of your stocks
Have feedback on this article? Concerned about the content? Get in touch with us directly. Alternatively, email editorial-team (at) simplywallst.com.
This article by Simply Wall St is general in nature. We provide commentary based on historical data and analyst forecasts only using an unbiased methodology and our articles are not intended to be financial advice. It does not constitute a recommendation to buy or sell any stock, and does not take account of your objectives, or your financial situation. We aim to bring you long-term focused analysis driven by fundamental data. Note that our analysis may not factor in the latest price-sensitive company announcements or qualitative material. Simply Wall St has no position in any stocks mentioned.
About NasdaqGS:JKHY
Jack Henry & Associates
A financial technology company that connects people and financial institutions through technology solutions and payment processing services that reduce the barriers to financial health.
Outstanding track record with excellent balance sheet and pays a dividend.
Similar Companies
Market Insights

Community Narratives


