Advertisement
- United States
- /
- Software
- /
- NasdaqGS:CHKP
Calculating The Fair Value Of Check Point Software Technologies Ltd. (NASDAQ:CHKP)
Key Insights
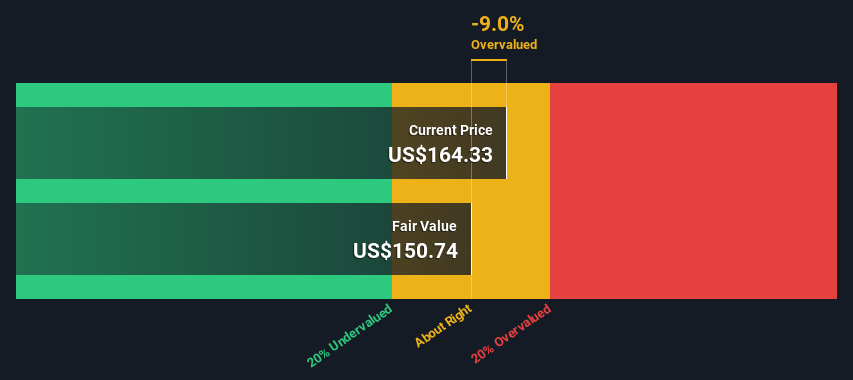
- Check Point Software Technologies' estimated fair value is US$151 based on 2 Stage Free Cash Flow to Equity
- Current share price of US$164 suggests Check Point Software Technologies is potentially trading close to its fair value
- Our fair value estimate is 11% lower than Check Point Software Technologies' analyst price target of US$170
In this article we are going to estimate the intrinsic value of Check Point Software Technologies Ltd. (NASDAQ:CHKP) by taking the expected future cash flows and discounting them to today's value. We will use the Discounted Cash Flow (DCF) model on this occasion. Before you think you won't be able to understand it, just read on! It's actually much less complex than you'd imagine.
We would caution that there are many ways of valuing a company and, like the DCF, each technique has advantages and disadvantages in certain scenarios. If you still have some burning questions about this type of valuation, take a look at the Simply Wall St analysis model.
View our latest analysis for Check Point Software Technologies
Is Check Point Software Technologies Fairly Valued?
We use what is known as a 2-stage model, which simply means we have two different periods of growth rates for the company's cash flows. Generally the first stage is higher growth, and the second stage is a lower growth phase. In the first stage we need to estimate the cash flows to the business over the next ten years. Where possible we use analyst estimates, but when these aren't available we extrapolate the previous free cash flow (FCF) from the last estimate or reported value. We assume companies with shrinking free cash flow will slow their rate of shrinkage, and that companies with growing free cash flow will see their growth rate slow, over this period. We do this to reflect that growth tends to slow more in the early years than it does in later years.
Generally we assume that a dollar today is more valuable than a dollar in the future, and so the sum of these future cash flows is then discounted to today's value:
10-year free cash flow (FCF) estimate
| 2024 | 2025 | 2026 | 2027 | 2028 | 2029 | 2030 | 2031 | 2032 | 2033 | |
| Levered FCF ($, Millions) | US$1.07b | US$1.15b | US$1.12b | US$1.11b | US$1.10b | US$1.11b | US$1.12b | US$1.14b | US$1.16b | US$1.18b |
| Growth Rate Estimate Source | Analyst x14 | Analyst x13 | Analyst x1 | Est @ -1.16% | Est @ -0.13% | Est @ 0.60% | Est @ 1.11% | Est @ 1.46% | Est @ 1.71% | Est @ 1.88% |
| Present Value ($, Millions) Discounted @ 7.9% | US$994 | US$989 | US$891 | US$816 | US$755 | US$704 | US$660 | US$620 | US$585 | US$552 |
("Est" = FCF growth rate estimated by Simply Wall St)
Present Value of 10-year Cash Flow (PVCF) = US$7.6b
The second stage is also known as Terminal Value, this is the business's cash flow after the first stage. For a number of reasons a very conservative growth rate is used that cannot exceed that of a country's GDP growth. In this case we have used the 5-year average of the 10-year government bond yield (2.3%) to estimate future growth. In the same way as with the 10-year 'growth' period, we discount future cash flows to today's value, using a cost of equity of 7.9%.
Terminal Value (TV)= FCF2033 × (1 + g) ÷ (r – g) = US$1.2b× (1 + 2.3%) ÷ (7.9%– 2.3%) = US$22b
Present Value of Terminal Value (PVTV)= TV / (1 + r)10= US$22b÷ ( 1 + 7.9%)10= US$10b
The total value, or equity value, is then the sum of the present value of the future cash flows, which in this case is US$18b. The last step is to then divide the equity value by the number of shares outstanding. Relative to the current share price of US$164, the company appears around fair value at the time of writing. Remember though, that this is just an approximate valuation, and like any complex formula - garbage in, garbage out.
Important Assumptions
We would point out that the most important inputs to a discounted cash flow are the discount rate and of course the actual cash flows. If you don't agree with these result, have a go at the calculation yourself and play with the assumptions. The DCF also does not consider the possible cyclicality of an industry, or a company's future capital requirements, so it does not give a full picture of a company's potential performance. Given that we are looking at Check Point Software Technologies as potential shareholders, the cost of equity is used as the discount rate, rather than the cost of capital (or weighted average cost of capital, WACC) which accounts for debt. In this calculation we've used 7.9%, which is based on a levered beta of 0.996. Beta is a measure of a stock's volatility, compared to the market as a whole. We get our beta from the industry average beta of globally comparable companies, with an imposed limit between 0.8 and 2.0, which is a reasonable range for a stable business.
SWOT Analysis for Check Point Software Technologies
Strength
- Earnings growth over the past year exceeded its 5-year average.
- Currently debt free.
Weakness
- Earnings growth over the past year underperformed the Software industry.
Opportunity
- Annual earnings are forecast to grow for the next 3 years.
- Good value based on P/E ratio compared to estimated Fair P/E ratio.
Threat
- Annual earnings are forecast to grow slower than the American market.
Looking Ahead:
Valuation is only one side of the coin in terms of building your investment thesis, and it ideally won't be the sole piece of analysis you scrutinize for a company. The DCF model is not a perfect stock valuation tool. Preferably you'd apply different cases and assumptions and see how they would impact the company's valuation. For example, changes in the company's cost of equity or the risk free rate can significantly impact the valuation. For Check Point Software Technologies, we've put together three pertinent elements you should further examine:
- Financial Health: Does CHKP have a healthy balance sheet? Take a look at our free balance sheet analysis with six simple checks on key factors like leverage and risk.
- Future Earnings: How does CHKP's growth rate compare to its peers and the wider market? Dig deeper into the analyst consensus number for the upcoming years by interacting with our free analyst growth expectation chart.
- Other Solid Businesses: Low debt, high returns on equity and good past performance are fundamental to a strong business. Why not explore our interactive list of stocks with solid business fundamentals to see if there are other companies you may not have considered!
PS. The Simply Wall St app conducts a discounted cash flow valuation for every stock on the NASDAQGS every day. If you want to find the calculation for other stocks just search here.
New: AI Stock Screener & Alerts
Our new AI Stock Screener scans the market every day to uncover opportunities.
• Dividend Powerhouses (3%+ Yield)
• Undervalued Small Caps with Insider Buying
• High growth Tech and AI Companies
Or build your own from over 50 metrics.
Have feedback on this article? Concerned about the content? Get in touch with us directly. Alternatively, email editorial-team (at) simplywallst.com.
This article by Simply Wall St is general in nature. We provide commentary based on historical data and analyst forecasts only using an unbiased methodology and our articles are not intended to be financial advice. It does not constitute a recommendation to buy or sell any stock, and does not take account of your objectives, or your financial situation. We aim to bring you long-term focused analysis driven by fundamental data. Note that our analysis may not factor in the latest price-sensitive company announcements or qualitative material. Simply Wall St has no position in any stocks mentioned.
About NasdaqGS:CHKP
Check Point Software Technologies
Develops, markets, and supports a range of products and services for IT security worldwide.
Outstanding track record with excellent balance sheet.
Similar Companies
Market Insights


Advertisement
Weekly Picks
LO


Lou_Basenese on Cue Biopharma ·
Cue Biopharma (NASDAQ: CUE): The Scientist Behind Xolair Just Gave Cue a Next-Generation Shot at the Same Multi-Billion-Dollar Market
Fair Value:US$7056.5% undervalued
25 followersusers have followed this narrative
0 commentsusers have commented on this narrative
5 likesusers have liked this narrative
HA


HarishPK on Adobe ·
Adobe: A Probabilistic Case for Undervaluation
Fair Value:US$317.225.0% undervalued
28 followersusers have followed this narrative
7 commentsusers have commented on this narrative
9 likesusers have liked this narrative
NI


niteco on Broadcom ·
A Capital Allocation Favorite with Structural Importance
Fair Value:US$651.0539.8% undervalued
24 followersusers have followed this narrative
0 commentsusers have commented on this narrative
3 likesusers have liked this narrative
TO


Tokyo on Okta ·
Good foundation, but now it's all about the next steps
Fair Value:US$15120.6% undervalued
83 followersusers have followed this narrative
7 commentsusers have commented on this narrative
11 likesusers have liked this narrative
Recently Updated Narratives
TE

Terence on Zenith Bank ·
Zenith Bank's Revenue To Surge by 18% in the Coming Years
Fair Value:₦93.5936.4% overvalued
1 followerusers have followed this narrative
0 commentsusers have commented on this narrative
0 likesusers have liked this narrative
MA


MarkoVT on ANYCOLOR ·
Near zero debt, Japan centric focus provides future growth
Fair Value:JP¥4.05k29.1% undervalued
6 followersusers have followed this narrative
0 commentsusers have commented on this narrative
1 likeusers have liked this narrative
RO


RockeTeller on 1911 Gold ·
1911 Gold, This Junior Gold Stock Has a 105% IRR and a 2027 Production Target
Fair Value:CA$12.7295.1% undervalued
87 followersusers have followed this narrative
12 commentsusers have commented on this narrative
0 likesusers have liked this narrative
Popular Narratives
MA


martinarauz on Nu Holdings ·
Investment Analysis (May 2026)
Fair Value:US$22.7447.8% undervalued
58 followersusers have followed this narrative
0 commentsusers have commented on this narrative
15 likesusers have liked this narrative
CL


Clive_Thompson on Take-Two Interactive Software ·
Take-Two Interactive: The Calm Before the Storm NASDAQ: TTWO Last Price: $242.41 Date: May 15, 2026
Fair Value:US$276.9723.4% undervalued
57 followersusers have followed this narrative
0 commentsusers have commented on this narrative
14 likesusers have liked this narrative
NI

niteco on Honeywell International ·
Honeywell - The Demand-Side of the AI Infrastructure
Fair Value:US$320.1932.6% undervalued
48 followersusers have followed this narrative
0 commentsusers have commented on this narrative
19 likesusers have liked this narrative
Trending Discussion

SI

Simply Wall St User on Access Holdings ·
It's wonderful. It has greatly helped me take informed decisions.
1
|0