- United States
- /
- Software
- /
- NasdaqGS:CDNS
Is Cadence Design Systems, Inc. (NASDAQ:CDNS) Expensive For A Reason? A Look At Its Intrinsic Value


Key Insights
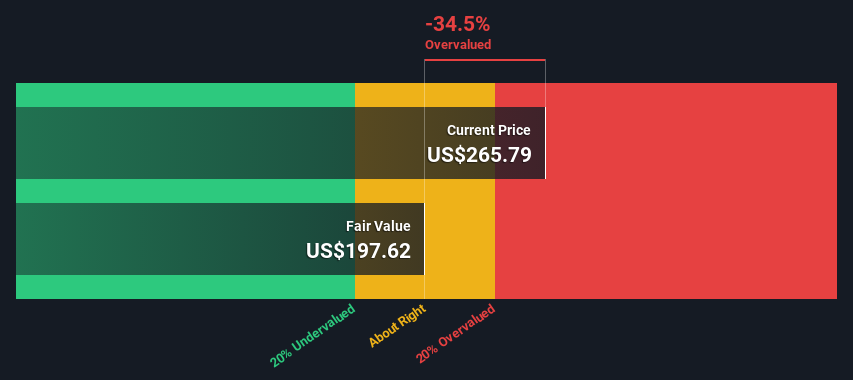
- Using the 2 Stage Free Cash Flow to Equity, Cadence Design Systems fair value estimate is US$198
- Current share price of US$266 suggests Cadence Design Systems is potentially 34% overvalued
- Our fair value estimate is 27% lower than Cadence Design Systems' analyst price target of US$271
Does the November share price for Cadence Design Systems, Inc. (NASDAQ:CDNS) reflect what it's really worth? Today, we will estimate the stock's intrinsic value by taking the expected future cash flows and discounting them to today's value. We will use the Discounted Cash Flow (DCF) model on this occasion. Models like these may appear beyond the comprehension of a lay person, but they're fairly easy to follow.
We would caution that there are many ways of valuing a company and, like the DCF, each technique has advantages and disadvantages in certain scenarios. If you want to learn more about discounted cash flow, the rationale behind this calculation can be read in detail in the Simply Wall St analysis model.
View our latest analysis for Cadence Design Systems
The Model
We are going to use a two-stage DCF model, which, as the name states, takes into account two stages of growth. The first stage is generally a higher growth period which levels off heading towards the terminal value, captured in the second 'steady growth' period. In the first stage we need to estimate the cash flows to the business over the next ten years. Where possible we use analyst estimates, but when these aren't available we extrapolate the previous free cash flow (FCF) from the last estimate or reported value. We assume companies with shrinking free cash flow will slow their rate of shrinkage, and that companies with growing free cash flow will see their growth rate slow, over this period. We do this to reflect that growth tends to slow more in the early years than it does in later years.
A DCF is all about the idea that a dollar in the future is less valuable than a dollar today, so we discount the value of these future cash flows to their estimated value in today's dollars:
10-year free cash flow (FCF) forecast
| 2024 | 2025 | 2026 | 2027 | 2028 | 2029 | 2030 | 2031 | 2032 | 2033 | |
| Levered FCF ($, Millions) | US$1.59b | US$1.85b | US$2.18b | US$2.48b | US$2.70b | US$2.88b | US$3.04b | US$3.18b | US$3.30b | US$3.42b |
| Growth Rate Estimate Source | Analyst x8 | Analyst x6 | Analyst x2 | Analyst x2 | Est @ 8.97% | Est @ 6.95% | Est @ 5.53% | Est @ 4.54% | Est @ 3.84% | Est @ 3.36% |
| Present Value ($, Millions) Discounted @ 7.1% | US$1.5k | US$1.6k | US$1.8k | US$1.9k | US$1.9k | US$1.9k | US$1.9k | US$1.8k | US$1.8k | US$1.7k |
("Est" = FCF growth rate estimated by Simply Wall St)
Present Value of 10-year Cash Flow (PVCF) = US$18b
The second stage is also known as Terminal Value, this is the business's cash flow after the first stage. For a number of reasons a very conservative growth rate is used that cannot exceed that of a country's GDP growth. In this case we have used the 5-year average of the 10-year government bond yield (2.2%) to estimate future growth. In the same way as with the 10-year 'growth' period, we discount future cash flows to today's value, using a cost of equity of 7.1%.
Terminal Value (TV)= FCF2033 × (1 + g) ÷ (r – g) = US$3.4b× (1 + 2.2%) ÷ (7.1%– 2.2%) = US$71b
Present Value of Terminal Value (PVTV)= TV / (1 + r)10= US$71b÷ ( 1 + 7.1%)10= US$36b
The total value, or equity value, is then the sum of the present value of the future cash flows, which in this case is US$54b. The last step is to then divide the equity value by the number of shares outstanding. Compared to the current share price of US$266, the company appears potentially overvalued at the time of writing. Remember though, that this is just an approximate valuation, and like any complex formula - garbage in, garbage out.
Important Assumptions
The calculation above is very dependent on two assumptions. The first is the discount rate and the other is the cash flows. You don't have to agree with these inputs, I recommend redoing the calculations yourself and playing with them. The DCF also does not consider the possible cyclicality of an industry, or a company's future capital requirements, so it does not give a full picture of a company's potential performance. Given that we are looking at Cadence Design Systems as potential shareholders, the cost of equity is used as the discount rate, rather than the cost of capital (or weighted average cost of capital, WACC) which accounts for debt. In this calculation we've used 7.1%, which is based on a levered beta of 0.977. Beta is a measure of a stock's volatility, compared to the market as a whole. We get our beta from the industry average beta of globally comparable companies, with an imposed limit between 0.8 and 2.0, which is a reasonable range for a stable business.
SWOT Analysis for Cadence Design Systems
- Earnings growth over the past year exceeded the industry.
- Debt is not viewed as a risk.
- Expensive based on P/E ratio and estimated fair value.
- Annual earnings are forecast to grow faster than the American market.
- Revenue is forecast to grow slower than 20% per year.
Looking Ahead:
Although the valuation of a company is important, it is only one of many factors that you need to assess for a company. It's not possible to obtain a foolproof valuation with a DCF model. Preferably you'd apply different cases and assumptions and see how they would impact the company's valuation. For instance, if the terminal value growth rate is adjusted slightly, it can dramatically alter the overall result. What is the reason for the share price exceeding the intrinsic value? For Cadence Design Systems, there are three essential items you should further research:
- Financial Health: Does CDNS have a healthy balance sheet? Take a look at our free balance sheet analysis with six simple checks on key factors like leverage and risk.
- Future Earnings: How does CDNS's growth rate compare to its peers and the wider market? Dig deeper into the analyst consensus number for the upcoming years by interacting with our free analyst growth expectation chart.
- Other High Quality Alternatives: Do you like a good all-rounder? Explore our interactive list of high quality stocks to get an idea of what else is out there you may be missing!
PS. Simply Wall St updates its DCF calculation for every American stock every day, so if you want to find the intrinsic value of any other stock just search here.
New: AI Stock Screener & Alerts
Our new AI Stock Screener scans the market every day to uncover opportunities.
• Dividend Powerhouses (3%+ Yield)
• Undervalued Small Caps with Insider Buying
• High growth Tech and AI Companies
Or build your own from over 50 metrics.
Have feedback on this article? Concerned about the content? Get in touch with us directly. Alternatively, email editorial-team (at) simplywallst.com.
This article by Simply Wall St is general in nature. We provide commentary based on historical data and analyst forecasts only using an unbiased methodology and our articles are not intended to be financial advice. It does not constitute a recommendation to buy or sell any stock, and does not take account of your objectives, or your financial situation. We aim to bring you long-term focused analysis driven by fundamental data. Note that our analysis may not factor in the latest price-sensitive company announcements or qualitative material. Simply Wall St has no position in any stocks mentioned.
About NasdaqGS:CDNS
Cadence Design Systems
Provides software, hardware, services, and reusable integrated circuit (IC) design blocks worldwide.
Excellent balance sheet with proven track record.
