Advertisement
- United States
- /
- Software
- /
- NasdaqGM:APPN
How Does the Latest Appian Court Win Impact Its 2025 Stock Outlook?

Simply Wall St
Reviewed by Bailey Pemberton
If you’re weighing whether to buy, hold, or walk away from Appian stock, you’re not alone in trying to crack the code. After all, Appian’s journey hasn’t exactly been a smooth ride. Recent months show a slide of -6.3% in the last week, -10.1% over the past month and -16.6% year to date. Zoom out a bit more and the one-year return puts the stock down -11.0%, while the longer view is even more dramatic: Appian is off by over -65% from its five-year highs. Those numbers might make some flinch, but they also prompt the question: has the market overreacted to shifting market dynamics and overlooked potential upside?
With a backdrop of evolving tech sentiment and rotation away from certain software stocks, investors are scrutinizing what sets Appian apart. Whether it is the impact of automation trends, changes in risk appetite, or simply a reevaluation of what growth should cost, this stock remains a talking point for anyone hunting value or just trying to avoid value traps. Notably, Appian clocks a valuation score of 3 out of 6, meaning it is checking the box for undervaluation on half of the major tests we will walk through in a moment.
If you’re looking for the “why” behind the current price and whether now is the time to act, let’s dive into the numbers. We will break down the main valuation methods and preview an even smarter way to look at Appian’s true worth before we are done.
Why Appian is lagging behind its peers
Approach 1: Appian Discounted Cash Flow (DCF) Analysis
The Discounted Cash Flow (DCF) model estimates a company's intrinsic value by forecasting its future cash flows and then discounting those projections back to their present value. This approach provides a way to assess what the business is truly worth today, based on expected growth and profitability in the years ahead.
For Appian, the starting point is its current Free Cash Flow (FCF) of approximately $41.2 million, all figures in $. Analysts anticipate this figure will grow steadily over the coming years, with forecasts projecting FCF to reach about $55.6 million by the end of 2026. Projections extend beyond this window, with long-term estimates, partly extrapolated, suggesting FCF could rise toward $109.8 million by 2035.
Using its 2 Stage Free Cash Flow to Equity model, the calculated fair value per share comes out to $18.50. However, the model also reveals Appian stock is currently trading at a roughly 49.6% premium to its intrinsic value, signaling it is significantly overvalued based on conservative cash flow expectations and current market pricing.
Result: OVERVALUED
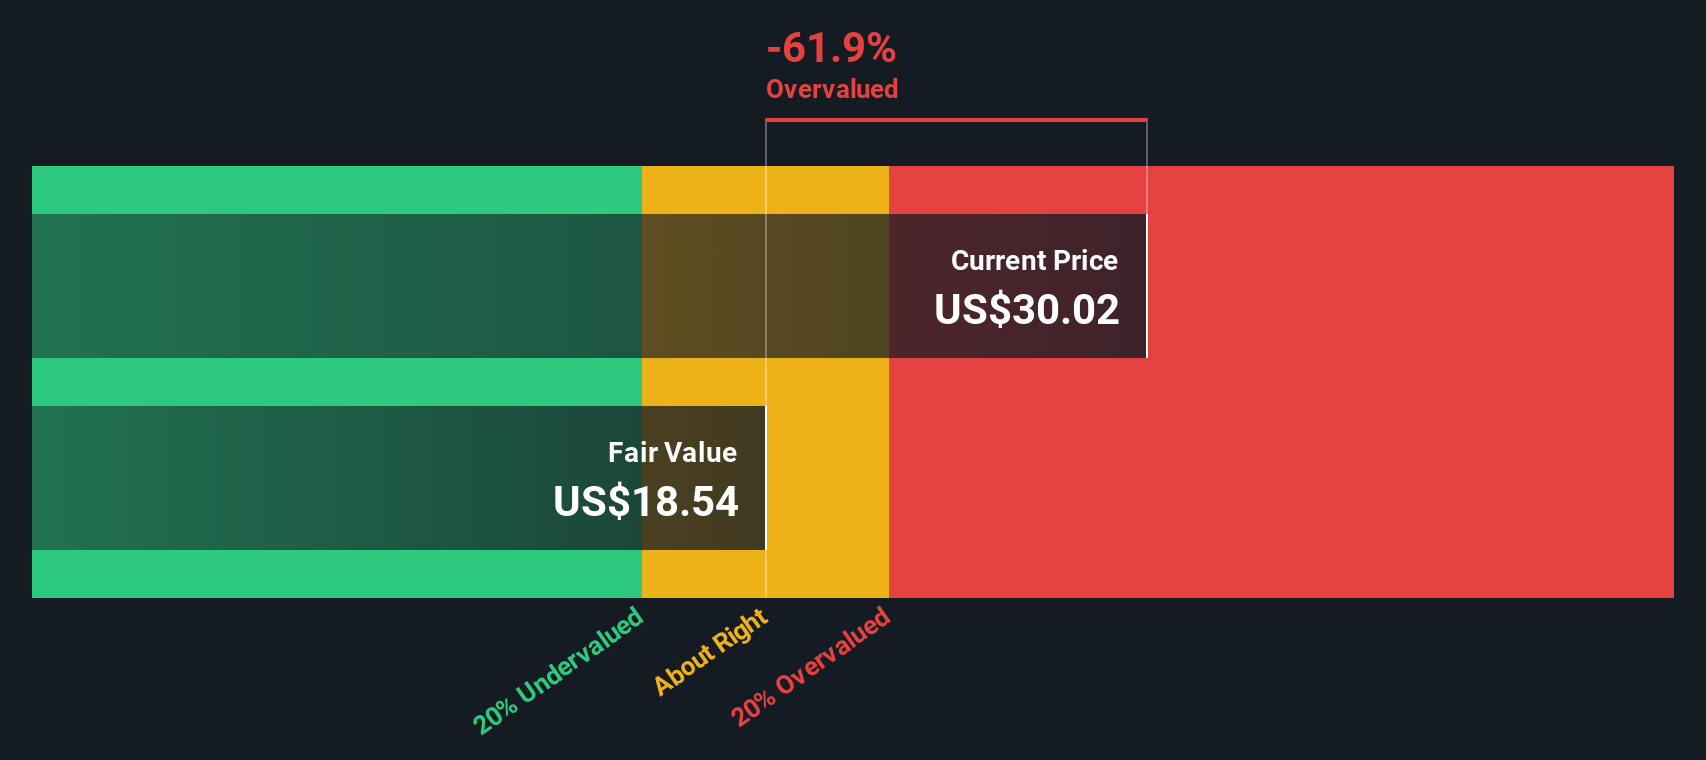
Our Discounted Cash Flow (DCF) analysis suggests Appian may be overvalued by 49.6%. Find undervalued stocks or create your own screener to find better value opportunities.
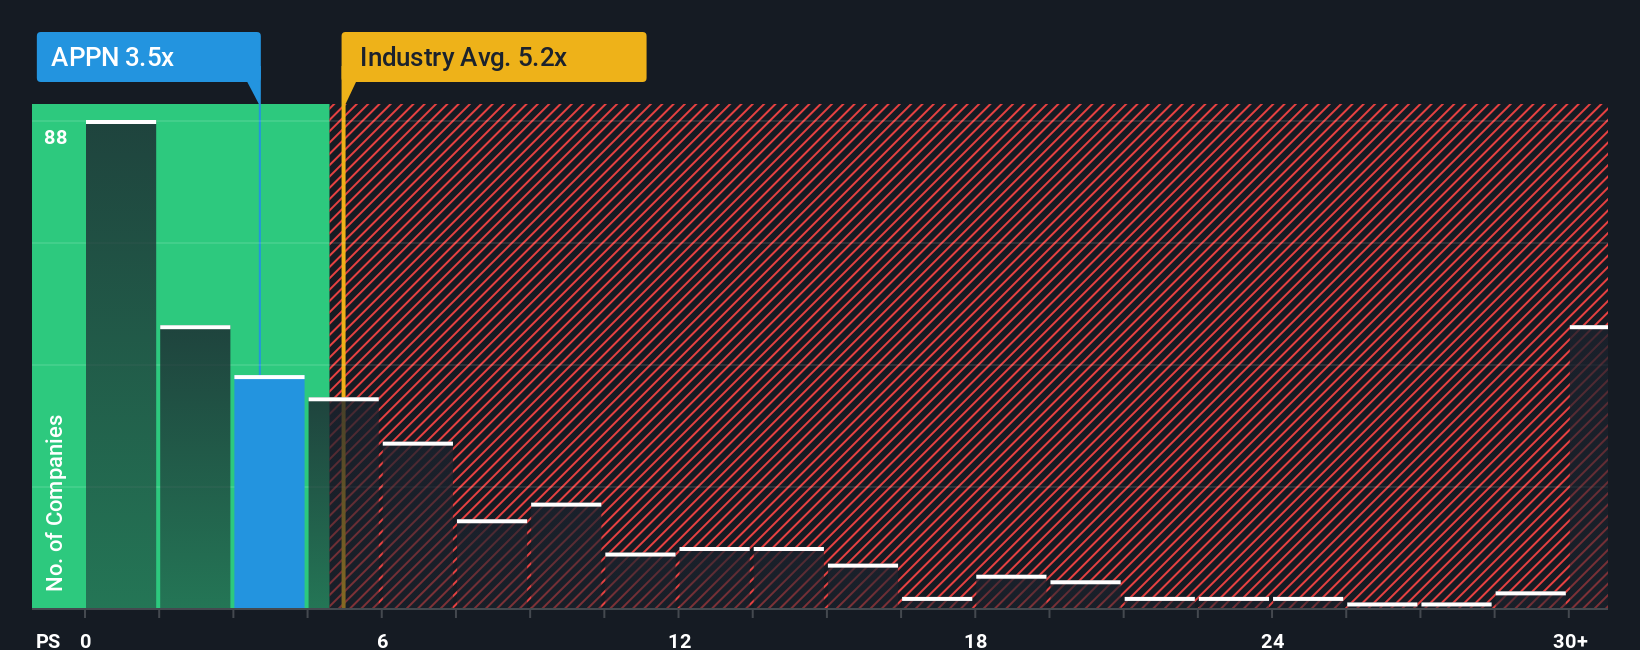
Approach 2: Appian Price vs Sales
The Price-to-Sales (P/S) ratio is often favored for valuing software companies like Appian, especially when profitability is limited or earnings are volatile. This metric gives a clearer picture for companies still investing heavily in growth, as it compares a company’s market value directly to its revenue rather than its net income.
Generally, companies with strong growth prospects and lower risk can justify a higher P/S ratio, while slower growth or greater uncertainties push the fair range lower. For Appian, the current P/S ratio stands at 3.12x. This is slightly above the peer group average of 2.82x but below the broader software industry average of 5.07x.
Simply Wall St introduces the "Fair Ratio," a proprietary yardstick customized for each company that considers not just industry and peer values, but also factors like earnings growth outlook, profit margins, scale, and risk profile. For Appian, the Fair Ratio is 4.42x. This means that, based on its fundamentals, the company’s revenue justifies a higher multiple than peers and even the industry average in some cases.
Given that Appian’s actual P/S of 3.12x is moderately below its Fair Ratio of 4.42x, the company looks undervalued on this key metric even after accounting for growth and risks using a more sophisticated approach than peer comparison alone.
Result: UNDERVALUED
PS ratios tell one story, but what if the real opportunity lies elsewhere? Discover companies where insiders are betting big on explosive growth.
Upgrade Your Decision Making: Choose your Appian Narrative
Earlier we mentioned there's an even better way to understand valuation, so let's introduce you to Narratives. A Narrative is your unique story about what a company’s future might look like. It captures not only the numbers you expect (like future revenue, margins, and a fair value) but also the reasons behind those expectations, tying together a company's journey, your research, and your perspective.
On Simply Wall St’s Community page, Narratives make sophisticated investing much more approachable by linking Appian’s story to financial forecasts and then to a real-world fair value. This lets anyone compare their view to others with just a few clicks.
This means you don’t just see static numbers, but can actively compare whether your thesis suggests Appian is a buy, hold, or sell relative to the current market price, and adjust your stance as new news, earnings results, or major announcements automatically update the Narrative’s assumptions.
For example, some investors see rapid AI-driven automation and Appian’s expanding platform as a catalyst for robust profit growth, and plug in optimistic forecasts which suggest a fair value of $42 per share. Others may worry about industry competition and high costs, and enter more cautious numbers, landing on a fair value as low as $29 per share.
Narratives put these perspectives side by side so you can make your own clear, data-driven call. The best part is, it is free to try on Simply Wall St.
Do you think there's more to the story for Appian? Create your own Narrative to let the Community know!

This article by Simply Wall St is general in nature. We provide commentary based on historical data and analyst forecasts only using an unbiased methodology and our articles are not intended to be financial advice. It does not constitute a recommendation to buy or sell any stock, and does not take account of your objectives, or your financial situation. We aim to bring you long-term focused analysis driven by fundamental data. Note that our analysis may not factor in the latest price-sensitive company announcements or qualitative material. Simply Wall St has no position in any stocks mentioned.
New: Manage All Your Stock Portfolios in One Place
We've created the ultimate portfolio companion for stock investors, and it's free.
• Connect an unlimited number of Portfolios and see your total in one currency
• Be alerted to new Warning Signs or Risks via email or mobile
• Track the Fair Value of your stocks
Have feedback on this article? Concerned about the content? Get in touch with us directly. Alternatively, email editorial-team@simplywallst.com
About NasdaqGM:APPN
Appian
Operates as a software company in the United States, Australia, Canada, France, Germany, India, Italy, Japan, Mexico, the Netherlands, Portugal, Singapore, Spain, Sweden, Switzerland, the United Kingdom, and internationally.
Fair value with imperfect balance sheet.
Similar Companies
Market Insights

Advertisement
Community Narratives
A formidable player in AI and enterprise computing.
Fair Value US$210.00|13.6% overvalued
CO
Community Contributor
IREN's Bold Moves in Sustainable Bitcoin Mining & AI Data Centers
Fair Value US$89.00|23.6% undervalued
BL
Community Contributor
Cooling the Champions: The Aussie Tech Behind F1's Victories
Fair Value AU$12.40|37.6% undervalued
TR
Community Contributor