Advertisement
- United States
- /
- Professional Services
- /
- NasdaqGS:ADP
Calculating The Intrinsic Value Of Automatic Data Processing, Inc. (NASDAQ:ADP)
Does the December share price for Automatic Data Processing, Inc. (NASDAQ:ADP) reflect what it's really worth? Today, we will estimate the stock's intrinsic value by projecting its future cash flows and then discounting them to today's value. Our analysis will employ the Discounted Cash Flow (DCF) model. Believe it or not, it's not too difficult to follow, as you'll see from our example!
We generally believe that a company's value is the present value of all of the cash it will generate in the future. However, a DCF is just one valuation metric among many, and it is not without flaws. If you want to learn more about discounted cash flow, the rationale behind this calculation can be read in detail in the Simply Wall St analysis model.
Check out our latest analysis for Automatic Data Processing
What's the estimated valuation?
We use what is known as a 2-stage model, which simply means we have two different periods of growth rates for the company's cash flows. Generally the first stage is higher growth, and the second stage is a lower growth phase. To start off with, we need to estimate the next ten years of cash flows. Where possible we use analyst estimates, but when these aren't available we extrapolate the previous free cash flow (FCF) from the last estimate or reported value. We assume companies with shrinking free cash flow will slow their rate of shrinkage, and that companies with growing free cash flow will see their growth rate slow, over this period. We do this to reflect that growth tends to slow more in the early years than it does in later years.
A DCF is all about the idea that a dollar in the future is less valuable than a dollar today, and so the sum of these future cash flows is then discounted to today's value:
10-year free cash flow (FCF) estimate
| 2022 | 2023 | 2024 | 2025 | 2026 | 2027 | 2028 | 2029 | 2030 | 2031 | |
| Levered FCF ($, Millions) | US$3.40b | US$3.69b | US$4.15b | US$4.48b | US$4.76b | US$4.97b | US$5.16b | US$5.32b | US$5.47b | US$5.61b |
| Growth Rate Estimate Source | Analyst x6 | Analyst x7 | Analyst x3 | Analyst x2 | Analyst x2 | Est @ 4.46% | Est @ 3.71% | Est @ 3.18% | Est @ 2.82% | Est @ 2.56% |
| Present Value ($, Millions) Discounted @ 6.6% | US$3.2k | US$3.2k | US$3.4k | US$3.5k | US$3.5k | US$3.4k | US$3.3k | US$3.2k | US$3.1k | US$3.0k |
("Est" = FCF growth rate estimated by Simply Wall St)
Present Value of 10-year Cash Flow (PVCF) = US$33b
The second stage is also known as Terminal Value, this is the business's cash flow after the first stage. The Gordon Growth formula is used to calculate Terminal Value at a future annual growth rate equal to the 5-year average of the 10-year government bond yield of 2.0%. We discount the terminal cash flows to today's value at a cost of equity of 6.6%.
Terminal Value (TV)= FCF2031 × (1 + g) ÷ (r – g) = US$5.6b× (1 + 2.0%) ÷ (6.6%– 2.0%) = US$124b
Present Value of Terminal Value (PVTV)= TV / (1 + r)10= US$124b÷ ( 1 + 6.6%)10= US$66b
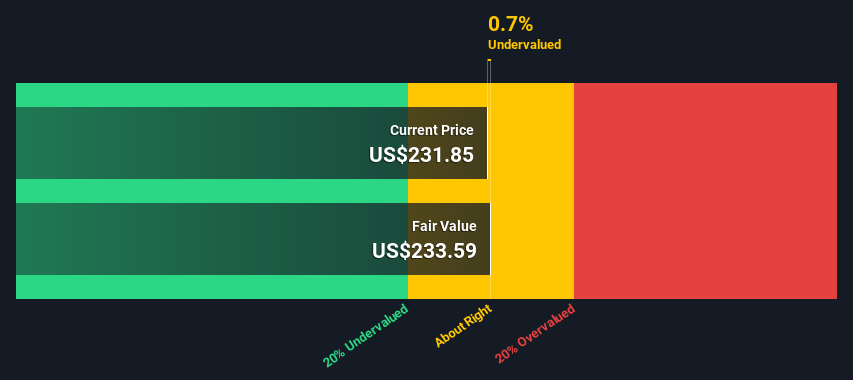
The total value, or equity value, is then the sum of the present value of the future cash flows, which in this case is US$98b. The last step is to then divide the equity value by the number of shares outstanding. Compared to the current share price of US$232, the company appears about fair value at a 0.7% discount to where the stock price trades currently. The assumptions in any calculation have a big impact on the valuation, so it is better to view this as a rough estimate, not precise down to the last cent.
Important assumptions
Now the most important inputs to a discounted cash flow are the discount rate, and of course, the actual cash flows. If you don't agree with these result, have a go at the calculation yourself and play with the assumptions. The DCF also does not consider the possible cyclicality of an industry, or a company's future capital requirements, so it does not give a full picture of a company's potential performance. Given that we are looking at Automatic Data Processing as potential shareholders, the cost of equity is used as the discount rate, rather than the cost of capital (or weighted average cost of capital, WACC) which accounts for debt. In this calculation we've used 6.6%, which is based on a levered beta of 1.053. Beta is a measure of a stock's volatility, compared to the market as a whole. We get our beta from the industry average beta of globally comparable companies, with an imposed limit between 0.8 and 2.0, which is a reasonable range for a stable business.
Next Steps:
Although the valuation of a company is important, it ideally won't be the sole piece of analysis you scrutinize for a company. It's not possible to obtain a foolproof valuation with a DCF model. Rather it should be seen as a guide to "what assumptions need to be true for this stock to be under/overvalued?" For instance, if the terminal value growth rate is adjusted slightly, it can dramatically alter the overall result. For Automatic Data Processing, we've put together three essential items you should further examine:
- Financial Health: Does ADP have a healthy balance sheet? Take a look at our free balance sheet analysis with six simple checks on key factors like leverage and risk.
- Future Earnings: How does ADP's growth rate compare to its peers and the wider market? Dig deeper into the analyst consensus number for the upcoming years by interacting with our free analyst growth expectation chart.
- Other Solid Businesses: Low debt, high returns on equity and good past performance are fundamental to a strong business. Why not explore our interactive list of stocks with solid business fundamentals to see if there are other companies you may not have considered!
PS. Simply Wall St updates its DCF calculation for every American stock every day, so if you want to find the intrinsic value of any other stock just search here.
New: Manage All Your Stock Portfolios in One Place
We've created the ultimate portfolio companion for stock investors, and it's free.
• Connect an unlimited number of Portfolios and see your total in one currency
• Be alerted to new Warning Signs or Risks via email or mobile
• Track the Fair Value of your stocks
Have feedback on this article? Concerned about the content? Get in touch with us directly. Alternatively, email editorial-team (at) simplywallst.com.
This article by Simply Wall St is general in nature. We provide commentary based on historical data and analyst forecasts only using an unbiased methodology and our articles are not intended to be financial advice. It does not constitute a recommendation to buy or sell any stock, and does not take account of your objectives, or your financial situation. We aim to bring you long-term focused analysis driven by fundamental data. Note that our analysis may not factor in the latest price-sensitive company announcements or qualitative material. Simply Wall St has no position in any stocks mentioned.
About NasdaqGS:ADP
Automatic Data Processing
Provides cloud-based human capital management (HCM) solutions worldwide.
Excellent balance sheet established dividend payer.
Similar Companies
Market Insights


Advertisement
Weekly Picks
CE


Ceazar on Sparc AI ·
When GPS fails: this small cap is fixing a $54B drone problem
Fair Value:CA$5.2552.0% undervalued
130 followersusers have followed this narrative
0 commentsusers have commented on this narrative
25 likesusers have liked this narrative
BL


BlackGoat on IREN ·
IREN's Bold Moves in Sustainable Bitcoin Mining & AI Data Centers
Fair Value:US$71.4848.5% undervalued
227 followersusers have followed this narrative
9 commentsusers have commented on this narrative
33 likesusers have liked this narrative
HE


HedgeY on Arm Holdings ·
The Architecture Layer of AI Computing - But Priced Like the Future Already Arrived?
Fair Value:US$43044.3% undervalued
27 followersusers have followed this narrative
1 commentusers have commented on this narrative
8 likesusers have liked this narrative
HI


Hidden_Rock_Capital on Fiserv ·
Temporary "perfect storm" leads to opportunity to buy financial services leader for less than 5x long-term earnings
Fair Value:US$119.9955.0% undervalued
36 followersusers have followed this narrative
1 commentusers have commented on this narrative
11 likesusers have liked this narrative
Recently Updated Narratives
CH

ChuckN on XPLR Infrastructure ·
Investor Thesis: Why XPLR Infrastructure Could Be Deeply Undervalued in an AI Power Cycle
Fair Value:US$209.0294.3% undervalued
5 followersusers have followed this narrative
0 commentsusers have commented on this narrative
0 likesusers have liked this narrative
AN


andre_santos on Netflix ·
Netflix - A Fundamental Valuation
Fair Value:US$98.7127.4% undervalued
10 followersusers have followed this narrative
0 commentsusers have commented on this narrative
0 likesusers have liked this narrative
JO


John_Eric on Reddit ·
Reddit's Discount Is Big Enough to Make Me Suspicious. Here's What I Found When I Went Looking for the Reason.
Fair Value:US$423.6866.8% undervalued
1 followerusers have followed this narrative
0 commentsusers have commented on this narrative
0 likesusers have liked this narrative
Popular Narratives
OS


oscargarcia on NVIDIA ·
The company that went from selling GPUs to gamers to becoming the AI arms dealer of the 21st century.
Fair Value:US$28028.3% undervalued
231 followersusers have followed this narrative
9 commentsusers have commented on this narrative
15 likesusers have liked this narrative
CU

CubanEros on Microsoft ·
A wonderful business at reasonable price.
Fair Value:US$419.9110.7% overvalued
111 followersusers have followed this narrative
0 commentsusers have commented on this narrative
7 likesusers have liked this narrative
TR


tripledub on Alphabet ·
Warren Buffett Just Bet $10 Billion on Google. The Catch? You May Already Be Too Late.
Fair Value:US$23054.8% overvalued
123 followersusers have followed this narrative
1 commentusers have commented on this narrative
18 likesusers have liked this narrative
Trending Discussion
GR
greg_xasak on Fiserv ·
As someone who has dealt directly with them as a CTO for a credit union, I have 8 years of horror stories about doing business with them. If there was any other competitor than could deliver 80% of Fiserv services, there would be a mad rush to migrate to them. They should thank their lucky stars they are a near monopoly. this industry is so ripe for a well funded competitor. Their integration of technology is awful, their ability to fix their own implementation screwups is sadly tragic. Sometimes they just silently kill support tickets without resolution and you never find out until you do a follow up inquiry. Why, because sometimes no one you are dealing with knows how to fix it and knows no one to ask for help. They can not meet their own implementation deadlines and sometimes there is no one on a technical team dealing with you that has any banking or credit union experience. The is an industry insider phrase when you meet other Fiserv customers called being "Fiserved". It means telling others of your worst stories of dealing with them. Ask around, all CTO's have some doozies.
2
|0

