- United States
- /
- Semiconductors
- /
- NasdaqGS:QCOM
Is QUALCOMM Incorporated's (NASDAQ:QCOM) Latest Stock Performance A Reflection Of Its Financial Health?

QUALCOMM (NASDAQ:QCOM) has had a great run on the share market with its stock up by a significant 23% over the last three months. Since the market usually pay for a company’s long-term fundamentals, we decided to study the company’s key performance indicators to see if they could be influencing the market. In this article, we decided to focus on QUALCOMM's ROE.
ROE or return on equity is a useful tool to assess how effectively a company can generate returns on the investment it received from its shareholders. Simply put, it is used to assess the profitability of a company in relation to its equity capital.
View our latest analysis for QUALCOMM
How Is ROE Calculated?
The formula for return on equity is:
Return on Equity = Net Profit (from continuing operations) ÷ Shareholders' Equity
So, based on the above formula, the ROE for QUALCOMM is:
34% = US$7.9b ÷ US$23b (Based on the trailing twelve months to December 2023).
The 'return' is the profit over the last twelve months. That means that for every $1 worth of shareholders' equity, the company generated $0.34 in profit.
What Is The Relationship Between ROE And Earnings Growth?
Thus far, we have learned that ROE measures how efficiently a company is generating its profits. Based on how much of its profits the company chooses to reinvest or "retain", we are then able to evaluate a company's future ability to generate profits. Generally speaking, other things being equal, firms with a high return on equity and profit retention, have a higher growth rate than firms that don’t share these attributes.
A Side By Side comparison of QUALCOMM's Earnings Growth And 34% ROE
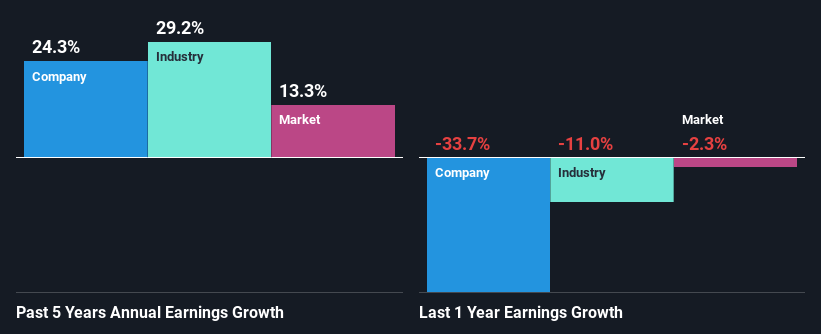
First thing first, we like that QUALCOMM has an impressive ROE. Secondly, even when compared to the industry average of 14% the company's ROE is quite impressive. Under the circumstances, QUALCOMM's considerable five year net income growth of 24% was to be expected.
We then performed a comparison between QUALCOMM's net income growth with the industry, which revealed that the company's growth is similar to the average industry growth of 29% in the same 5-year period.
Earnings growth is an important metric to consider when valuing a stock. What investors need to determine next is if the expected earnings growth, or the lack of it, is already built into the share price. Doing so will help them establish if the stock's future looks promising or ominous. What is QCOM worth today? The intrinsic value infographic in our free research report helps visualize whether QCOM is currently mispriced by the market.
Is QUALCOMM Making Efficient Use Of Its Profits?
The three-year median payout ratio for QUALCOMM is 32%, which is moderately low. The company is retaining the remaining 68%. This suggests that its dividend is well covered, and given the high growth we discussed above, it looks like QUALCOMM is reinvesting its earnings efficiently.
Besides, QUALCOMM has been paying dividends for at least ten years or more. This shows that the company is committed to sharing profits with its shareholders. Our latest analyst data shows that the future payout ratio of the company over the next three years is expected to be approximately 32%. Accordingly, forecasts suggest that QUALCOMM's future ROE will be 34% which is again, similar to the current ROE.
Conclusion
On the whole, we feel that QUALCOMM's performance has been quite good. In particular, it's great to see that the company is investing heavily into its business and along with a high rate of return, that has resulted in a sizeable growth in its earnings. That being so, a study of the latest analyst forecasts show that the company is expected to see a slowdown in its future earnings growth. Are these analysts expectations based on the broad expectations for the industry, or on the company's fundamentals? Click here to be taken to our analyst's forecasts page for the company.
Mobile Infrastructure for Defense and Disaster
The next wave in robotics isn't humanoid. Its fully autonomous towers delivering 5G, ISR, and radar in under 30 minutes, anywhere.
Get the investor briefing before the next round of contracts
Sponsored On Behalf of CiTechValuation is complex, but we're here to simplify it.
Discover if QUALCOMM might be undervalued or overvalued with our detailed analysis, featuring fair value estimates, potential risks, dividends, insider trades, and its financial condition.
Access Free AnalysisHave feedback on this article? Concerned about the content? Get in touch with us directly. Alternatively, email editorial-team (at) simplywallst.com.
This article by Simply Wall St is general in nature. We provide commentary based on historical data and analyst forecasts only using an unbiased methodology and our articles are not intended to be financial advice. It does not constitute a recommendation to buy or sell any stock, and does not take account of your objectives, or your financial situation. We aim to bring you long-term focused analysis driven by fundamental data. Note that our analysis may not factor in the latest price-sensitive company announcements or qualitative material. Simply Wall St has no position in any stocks mentioned.
About NasdaqGS:QCOM
QUALCOMM
Engages in the development and commercialization of foundational technologies for the wireless industry worldwide.
Flawless balance sheet established dividend payer.
Similar Companies
Market Insights

Weekly Picks

THE KINGDOM OF BROWN GOODS: WHY MGPI IS BEING CRUSHED BY INVENTORY & PRIMED FOR RESURRECTION


Why Vertical Aerospace (NYSE: EVTL) is Worth Possibly Over 13x its Current Price


The Quiet Giant That Became AI’s Power Grid
Recently Updated Narratives


A tech powerhouse quietly powering the world’s AI infrastructure.


Keppel DC REIT (SGX: AJBU) is a resilient gem in the data center space.
Why Vertical Aerospace (NYSE: EVTL) is Worth Possibly Over 13x its Current Price
Popular Narratives

MicroVision will explode future revenue by 380.37% with a vision towards success


Crazy Undervalued 42 Baggers Silver Play (Active & Running Mine)


