Advertisement
- United States
- /
- Semiconductors
- /
- NasdaqGS:AVGO
Is Broadcom Still Worth the Price After Apple Reduces Chip Orders in 2025?

Simply Wall St
Reviewed by Simply Wall St
Thinking about what to do with Broadcom stock? You are not alone. With another year of big returns in the rearview mirror, investors are trying to decide if now is the right time to buy, hold, or look elsewhere. Broadcom’s price has been on a tear for years, soaring nearly 1,000% over five years. Even in the past twelve months alone, the stock has rocketed 97.8%. That type of momentum has turned a lot of heads, including plenty of new ones. But there is more to the story than relentless gains and FOMO.
Just a week’s time can bring big swings. Over the last 30 days, Broadcom shares jumped 15.2%, although a recent 6.9% pullback in the past week reminds us that rapid growth often comes with bouts of volatility. The stock has been in the headlines lately, sometimes for good reasons such as co-designing AI chips for OpenAI, and sometimes for more cautionary tales, such as Apple reducing its reliance on Broadcom chips in its latest iPhones. Even top executives have been cashing in, with Broadcom’s CEO recently selling a significant chunk of shares.
So is Broadcom still a deal, or are all these gains already priced in? According to a common valuation scoring system, Broadcom is currently undervalued in 0 out of 6 standard checks, which translates to a value score of 0. But what does that really mean? In the next section, we will break down each valuation approach and see how they stack up for Broadcom. There is one angle on valuation, often overlooked, that might tell us even more.
Broadcom scores just 0/6 on our valuation checks. See what other red flags we found in the full valuation breakdown.Approach 1: Broadcom Discounted Cash Flow (DCF) Analysis
The Discounted Cash Flow (DCF) model values a company by forecasting its future cash flows and discounting them back to what they are worth in today’s dollars. This method relies on estimates of how much cash Broadcom can generate over the coming years. It is a popular choice for long-term investors looking to gauge a business’s intrinsic value beyond market hype.
For Broadcom, the current Free Cash Flow stands at approximately $24.8 billion. Analysts predict growth for several years ahead. By 2028, projections see Free Cash Flow reaching about $66.9 billion. While analyst consensus only covers the next five years, further projections are extrapolated to show potential cash flows continuing to rise over the next decade.
Taking all those forecasts and discounting them back to present value, the DCF model estimates Broadcom’s fair value at $229.45 per share. Compared to the actual share price, this implies the stock is now trading at a 47.7% premium to its intrinsic value. In other words, the market currently sees much more potential than the model does at today’s price.
Result: OVERVALUED
Head to the Valuation section of our Company Report for more details on how we arrive at this Fair Value for Broadcom.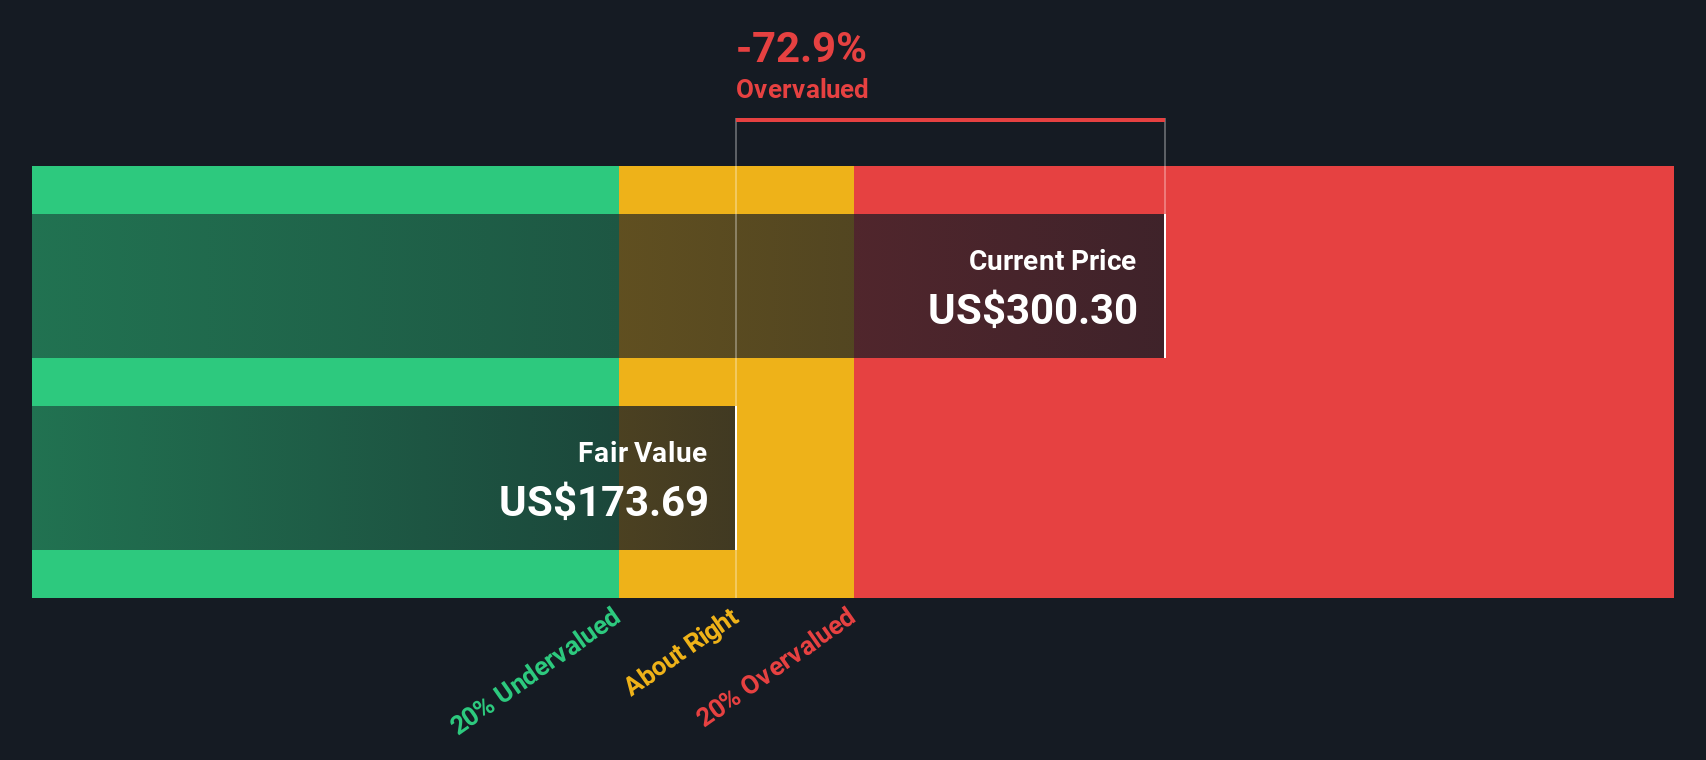
Approach 2: Broadcom Price vs Earnings (PE)
The Price-to-Earnings (PE) ratio is a widely used valuation tool, especially for profitable companies like Broadcom, because it offers a quick snapshot of what investors are willing to pay for each dollar of earnings. Generally, a higher PE ratio reflects expectations of higher future growth or lower business risk. In contrast, a lower ratio might signal more modest growth prospects or greater uncertainty around future performance.
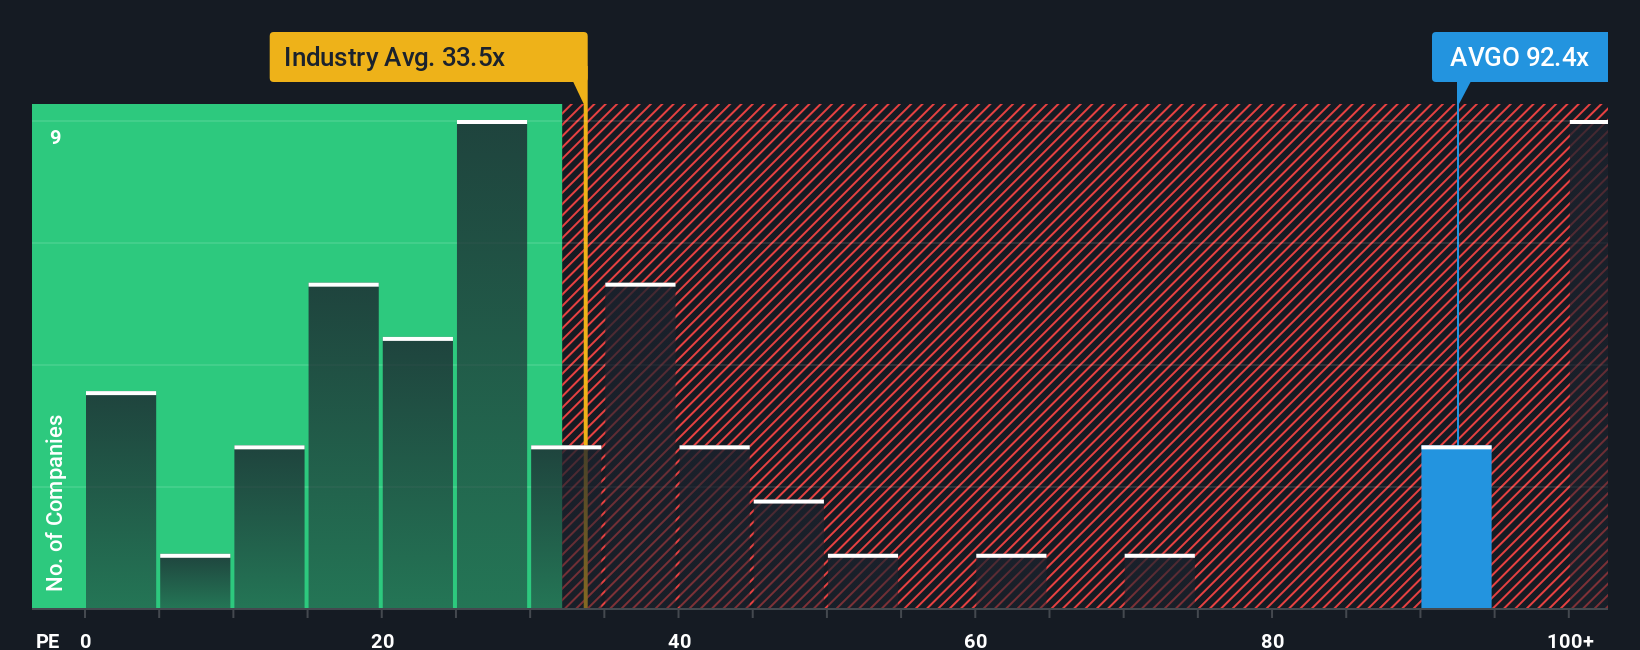
Currently, Broadcom’s PE ratio stands at 85x, which is notably higher than both the semiconductor industry average of 35x and the average of its peer group at 48x. This difference highlights just how much optimism is currently priced into the stock. However, simply comparing PE ratios across companies and industries can be misleading since not every business operates with the same growth outlook, risk profile, or profit margins.
This is where Simply Wall St’s Fair Ratio comes in. Unlike basic comparisons, the Fair Ratio is tailored to Broadcom, factoring in its unique earnings growth potential, profit margin, market capitalization, and risk profile, as well as its industry context. For Broadcom, the Fair Ratio is 53x. This is significantly lower than its actual PE ratio of 85x. This difference suggests that the market’s enthusiasm may be overshooting what is justified by fundamentals, even after accounting for Broadcom’s impressive growth story.
Result: OVERVALUED
Upgrade Your Decision Making: Choose your Broadcom Narrative
Earlier we mentioned that there is an even better way to understand valuation, so let us introduce you to Narratives. At Simply Wall St, a Narrative is your personal story, the perspective you have about a company's future, tied to your own financial forecasts, assumptions about revenue, earnings, and profit margins, and ultimately your own view of fair value. A Narrative connects what you believe about a business to a data-driven forecast and a calculated price, making it much more powerful than static ratios or models alone.
Narratives are available to millions of investors on the Simply Wall St Community page, where you can see how others are evaluating stocks like Broadcom, or create your own. They help you decide when to buy or sell by directly comparing your fair value estimate with the actual share price and are automatically updated when new news or earnings numbers are reported. For example, one Broadcom Narrative projects accelerating AI demand and margin expansion, leading to a bullish fair value as high as $415.56, while another with a more cautious outlook sees fair value as low as $218.00. This shows just how much your decision can (and should) depend on your personal research and expectations.
Do you think there's more to the story for Broadcom? Create your own Narrative to let the Community know!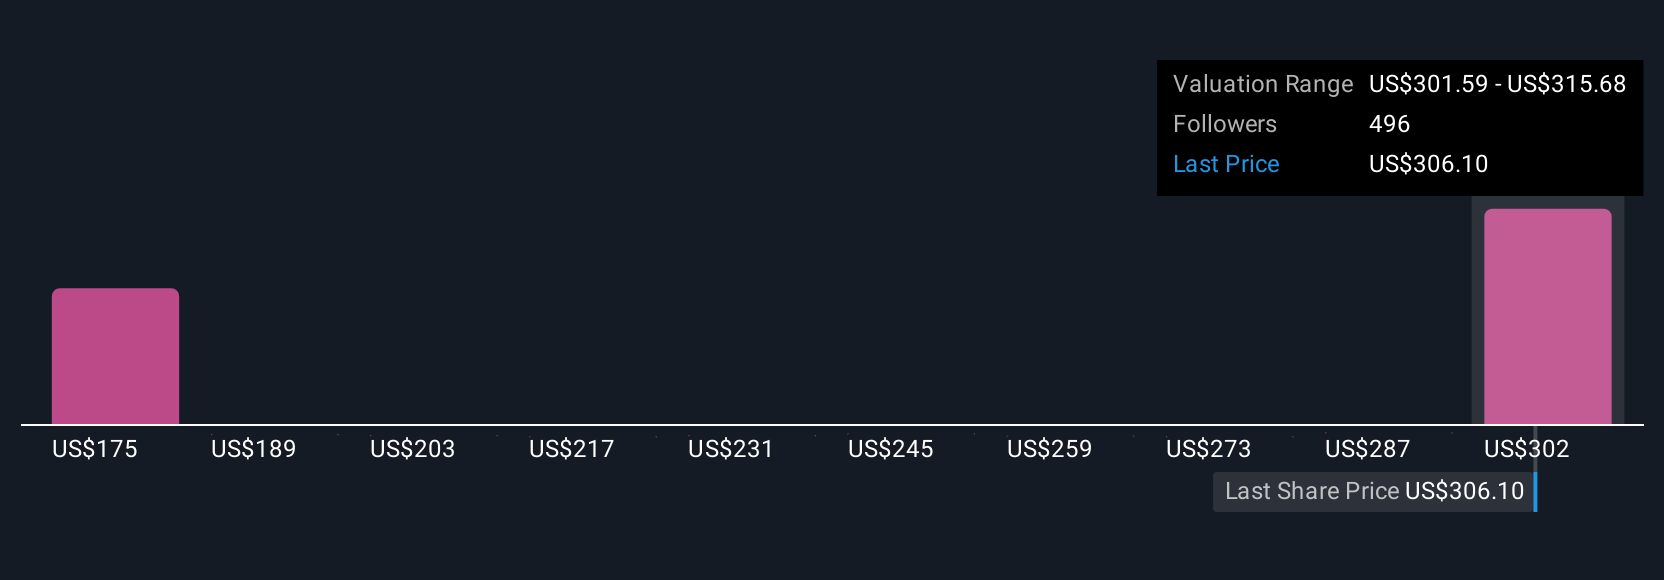
This article by Simply Wall St is general in nature. We provide commentary based on historical data and analyst forecasts only using an unbiased methodology and our articles are not intended to be financial advice. It does not constitute a recommendation to buy or sell any stock, and does not take account of your objectives, or your financial situation. We aim to bring you long-term focused analysis driven by fundamental data. Note that our analysis may not factor in the latest price-sensitive company announcements or qualitative material. Simply Wall St has no position in any stocks mentioned.
Valuation is complex, but we're here to simplify it.
Discover if Broadcom might be undervalued or overvalued with our detailed analysis, featuring fair value estimates, potential risks, dividends, insider trades, and its financial condition.
Access Free AnalysisHave feedback on this article? Concerned about the content? Get in touch with us directly. Alternatively, email editorial-team@simplywallst.com
About NasdaqGS:AVGO
Broadcom
Designs, develops, and supplies various semiconductor devices and infrastructure software solutions worldwide.
Exceptional growth potential with outstanding track record.
Similar Companies
Market Insights

Advertisement
Community Narratives
America Wants Homegrown Drones — Draganfly Is Ready to Deliver
Fair Value US$9.21|28.9% undervalued
JO
Community Contributor
Cheesecake Factory offers an enticing opportunity for long-term growth by leveraging new concepts
Fair Value US$73.83|27.0% undervalued
ZW
Community Contributor
Coca-Cola’s Intrinsic Value Set to Rise with Fed Rate Cut
Fair Value US$67.50|1.9% undervalued
AL
Community Contributor
Fully Permitted Gold Mine with 50 Baggers Potential 
Fair Value CA$41.00|98.5% undervalued
RO
Community Contributor