Advertisement
- United States
- /
- Semiconductors
- /
- NasdaqGS:AVGO
How Will Apple’s New N1 Chip Impact Broadcom’s Current Price Surge?

Simply Wall St
Reviewed by Bailey Pemberton
If you're looking at Broadcom and wondering whether this is the moment to buy, sell, or just sit tight, you're not alone. With its share price recently closing at $324.63, Broadcom has seen its fair share of twists and turns. Just in the last week, the stock slipped by 4.1% and is down 12.2% in the past month. But take a step back, and the longer-term rally is hard to miss: up 39.9% year-to-date, 80.6% in the past year, and a staggering 700.1% over three years.
These powerful gains haven’t been without drama. Industry headlines have come thick and fast, with Apple announcing its own in-house N1 wireless chip, potentially reducing its reliance on Broadcom in future iPhone models. At the same time, Broadcom is forging deeper connections in the AI space, working with OpenAI to co-design the next wave of artificial intelligence chips. Even with some competitive rumblings, like MediaTek edging Broadcom out for a certain Meta project, the overall narrative remains: Broadcom's role in tech infrastructure continues to evolve at a rapid clip, stoking both optimism and uncertainty in equal measure.
But what does all this mean for the stock’s value today? Based on traditional yardsticks, Broadcom currently has a valuation score of 0 out of 6, meaning it isn't considered undervalued in any of the six standard checks. Of course, numbers never tell the full story. Let’s dig into how analysts typically approach valuation, and why there might be a better way to assess Broadcom’s real investment potential by the end of this article.
Broadcom scores just 0/6 on our valuation checks. See what other red flags we found in the full valuation breakdown.
Approach 1: Broadcom Discounted Cash Flow (DCF) Analysis
The Discounted Cash Flow (DCF) model is a valuation method that estimates a company's intrinsic value by projecting its future cash flows and then discounting those amounts back to today's dollars. This provides investors with a sense of what the business could be worth relative to its current market value.
For Broadcom, the most recent reported Free Cash Flow stands at $24.8 Billion. Analysts provide cash flow projections for up to five years into the future, and for Broadcom these forecasts indicate a rapid growth trajectory. According to the projections, annual Free Cash Flow is expected to climb to approximately $110.4 Billion by 2035, based on a mix of analyst estimates and longer-term extrapolations.
With these robust growth assumptions, the DCF model arrives at an estimated intrinsic value for Broadcom stock of $224.82 per share. Compared to the current share price of $324.63, this suggests the stock is trading roughly 44.4% above its fair value according to the model.
Result: OVERVALUED
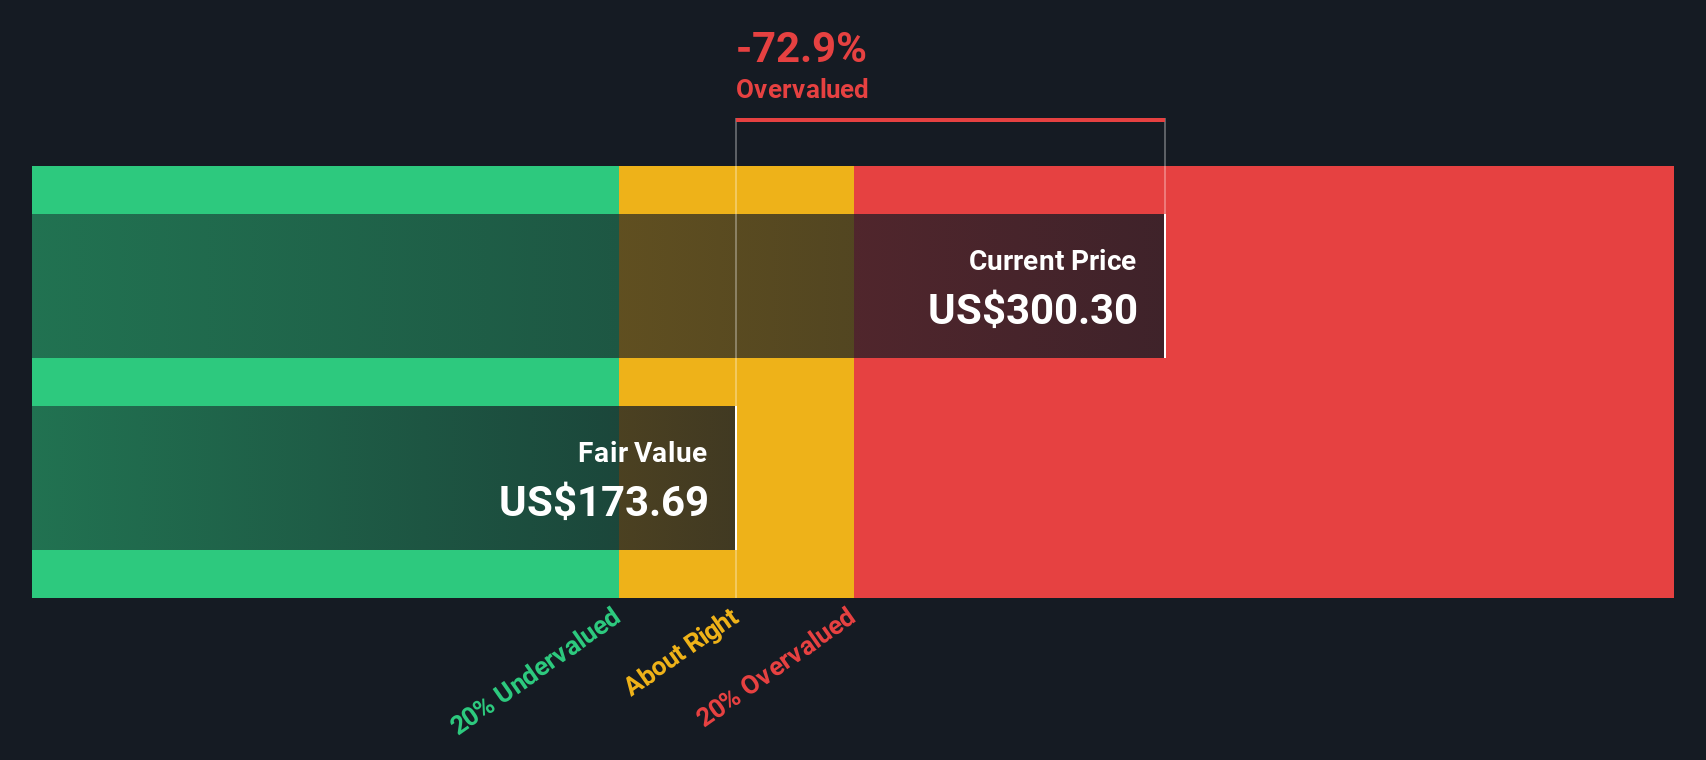
Our Discounted Cash Flow (DCF) analysis suggests Broadcom may be overvalued by 44.4%. Find undervalued stocks or create your own screener to find better value opportunities.
Approach 2: Broadcom Price vs Earnings (PE)
For profitable companies like Broadcom, the Price-to-Earnings (PE) ratio is one of the most widely used valuation metrics. It gives investors a quick sense of how much they're paying for each dollar of current earnings, and it works best when a company is not only earning profits, but also expected to generate consistent earnings growth.
Typically, a “normal” or “fair” PE ratio is shaped by expectations of future earnings growth along with perceived risks. Higher growth prospects may justify a higher PE, while greater financial or operational risk would usually push it lower.
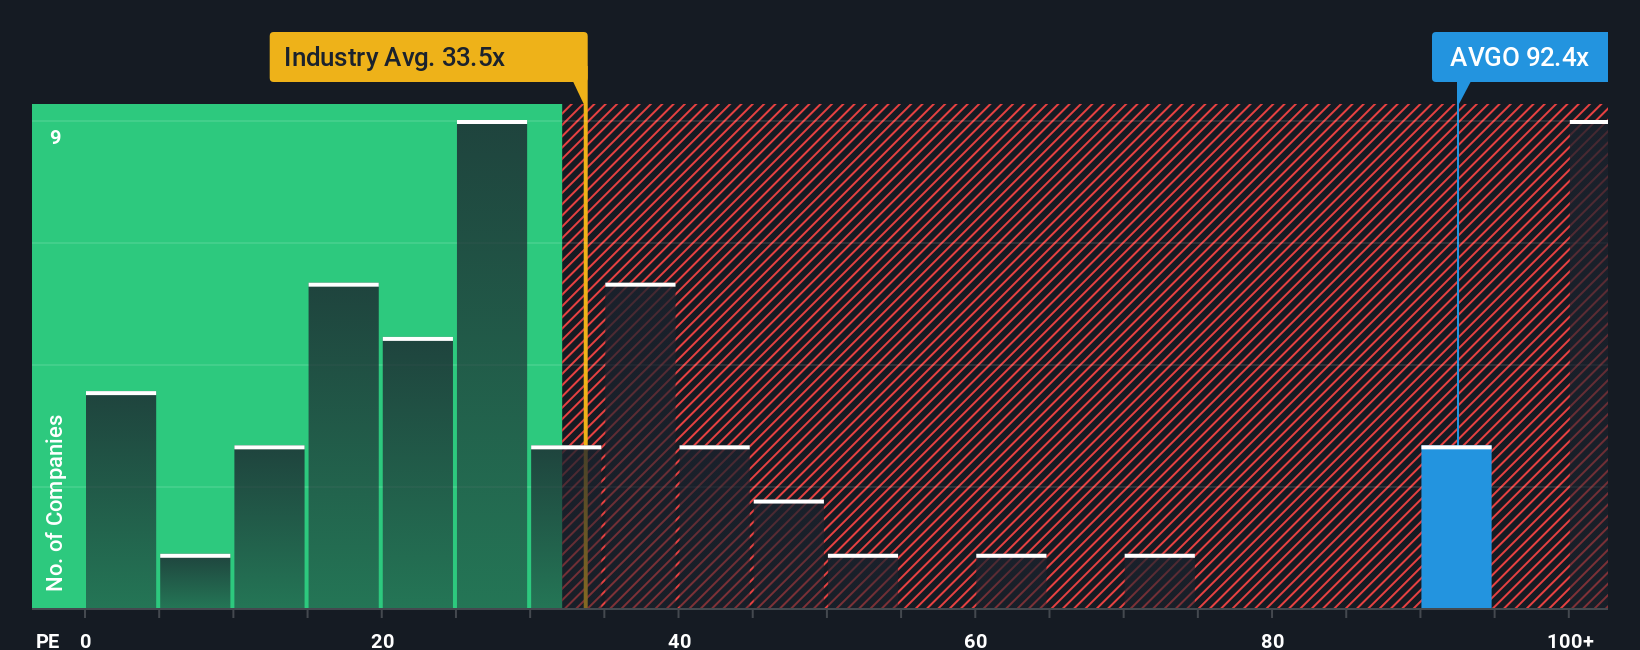
Right now, Broadcom trades at a PE ratio of 81.5x. To put this in perspective, that's well above the semiconductor industry average of 38.3x and higher than the average for its peer group, which sits at 54.3x. However, not all companies operate on a level playing field. This is where the Fair Ratio comes in.
The Fair Ratio, calculated by Simply Wall St, represents a customized valuation multiple for Broadcom, considering its earnings growth, profit margins, market cap, risk profile and where it sits within its industry. This tailored approach cuts through noise by giving you a more nuanced, company-specific benchmark, rather than relying solely on broad industry numbers or peers that may have very different growth stories or risk factors.
Broadcom’s Fair Ratio stands at 61.1x, noticeably lower than its current PE of 81.5x. This suggests the stock is valued significantly above what would be justified even after accounting for its strong growth and profitability.
Result: OVERVALUED
PE ratios tell one story, but what if the real opportunity lies elsewhere? Discover companies where insiders are betting big on explosive growth.
Upgrade Your Decision Making: Choose your Broadcom Narrative
Earlier, we mentioned there is an even better way to understand valuation, so let’s introduce you to Narratives. A Narrative is your personal story behind the numbers, connecting what you believe about Broadcom’s future, such as its revenue, earnings, and margins, to a fair value and investment decision.
Narratives let you bridge Broadcom’s evolving business story with concrete financial forecasts. This approach shows not only what the numbers are, but why you believe they matter, making it easier to see how your view may differ from others. On Simply Wall St’s Community page, millions of investors are already using Narratives as an accessible tool to set their own assumptions, see fair value estimates instantly, and decide whether to buy, sell, or hold based on real-time comparisons between price and value.
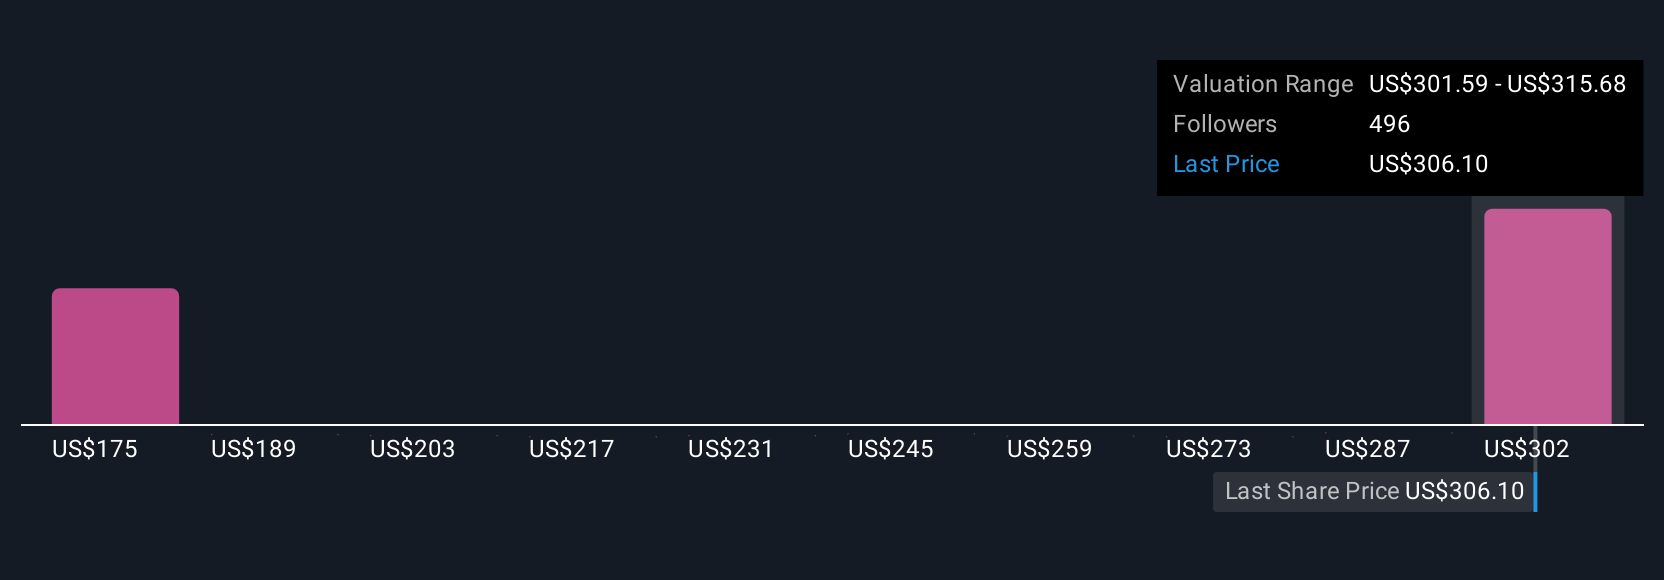
What sets Narratives apart is their dynamic nature: as new news, earnings, or business events unfold, your fair value is updated automatically, helping you react with clarity instead of emotion. For example, while some investors see Broadcom’s AI demand and VMware integration driving value as high as $415.56 per share, others are more cautious, estimating a fair value as low as $218.00. This shows just how powerful differing perspectives can be when backed by a clear narrative.
Do you think there's more to the story for Broadcom? Create your own Narrative to let the Community know!
This article by Simply Wall St is general in nature. We provide commentary based on historical data and analyst forecasts only using an unbiased methodology and our articles are not intended to be financial advice. It does not constitute a recommendation to buy or sell any stock, and does not take account of your objectives, or your financial situation. We aim to bring you long-term focused analysis driven by fundamental data. Note that our analysis may not factor in the latest price-sensitive company announcements or qualitative material. Simply Wall St has no position in any stocks mentioned.
Valuation is complex, but we're here to simplify it.
Discover if Broadcom might be undervalued or overvalued with our detailed analysis, featuring fair value estimates, potential risks, dividends, insider trades, and its financial condition.
Access Free AnalysisHave feedback on this article? Concerned about the content? Get in touch with us directly. Alternatively, email editorial-team@simplywallst.com
About NasdaqGS:AVGO
Broadcom
Designs, develops, and supplies various semiconductor devices and infrastructure software solutions worldwide.
Exceptional growth potential with outstanding track record.
Similar Companies
Market Insights

Advertisement
Community Narratives
A formidable player in AI and enterprise computing.
Fair Value US$210.00|12.2% overvalued
CO
Community Contributor
IREN's Bold Moves in Sustainable Bitcoin Mining & AI Data Centers
Fair Value US$72.52|17.1% undervalued
BL
Community Contributor
Cooling the Champions: The Aussie Tech Behind F1's Victories
Fair Value AU$12.40|38.7% undervalued
TR
Community Contributor