
Advertisement
- United States
- /
- Specialty Stores
- /
- NYSE:SIG
Investors in Signet Jewelers (NYSE:SIG) have seen enviable returns of 602% over the past three years

It might be of some concern to shareholders to see the Signet Jewelers Limited (NYSE:SIG) share price down 11% in the last month. But over the last three years the stock has shone bright like a diamond. The longer term view reveals that the share price is up 587% in that period. As long term investors the recent fall doesn't detract all that much from the longer term story. Only time will tell if there is still too much optimism currently reflected in the share price. We love happy stories like this one. The company should be really proud of that performance!
So let's investigate and see if the longer term performance of the company has been in line with the underlying business' progress.
See our latest analysis for Signet Jewelers
SWOT Analysis for Signet Jewelers
Strength
- Debt is not viewed as a risk.
- Dividends are covered by earnings and cash flows.
Weakness
- Earnings declined over the past year.
- Dividend is low compared to the top 25% of dividend payers in the Specialty Retail market.
Opportunity
- Annual earnings are forecast to grow faster than the American market.
- Good value based on P/E ratio and estimated fair value.
Threat
- Annual revenue is forecast to grow slower than the American market.
While markets are a powerful pricing mechanism, share prices reflect investor sentiment, not just underlying business performance. One imperfect but simple way to consider how the market perception of a company has shifted is to compare the change in the earnings per share (EPS) with the share price movement.
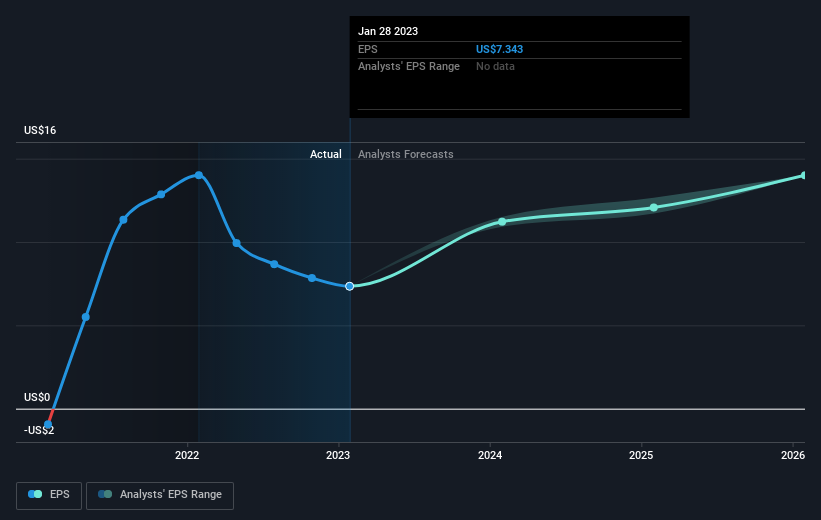
Signet Jewelers was able to grow its EPS at 75% per year over three years, sending the share price higher. We don't think it is entirely coincidental that the EPS growth is reasonably close to the 90% average annual increase in the share price. That suggests that the market sentiment around the company hasn't changed much over that time. Rather, the share price has approximately tracked EPS growth.
The image below shows how EPS has tracked over time (if you click on the image you can see greater detail).
We know that Signet Jewelers has improved its bottom line over the last three years, but what does the future have in store? You can see how its balance sheet has strengthened (or weakened) over time in this free interactive graphic.
What About Dividends?
It is important to consider the total shareholder return, as well as the share price return, for any given stock. Whereas the share price return only reflects the change in the share price, the TSR includes the value of dividends (assuming they were reinvested) and the benefit of any discounted capital raising or spin-off. So for companies that pay a generous dividend, the TSR is often a lot higher than the share price return. We note that for Signet Jewelers the TSR over the last 3 years was 602%, which is better than the share price return mentioned above. And there's no prize for guessing that the dividend payments largely explain the divergence!
A Different Perspective
It's nice to see that Signet Jewelers shareholders have received a total shareholder return of 30% over the last year. That's including the dividend. Since the one-year TSR is better than the five-year TSR (the latter coming in at 13% per year), it would seem that the stock's performance has improved in recent times. Given the share price momentum remains strong, it might be worth taking a closer look at the stock, lest you miss an opportunity. It's always interesting to track share price performance over the longer term. But to understand Signet Jewelers better, we need to consider many other factors. Consider for instance, the ever-present spectre of investment risk. We've identified 3 warning signs with Signet Jewelers , and understanding them should be part of your investment process.
But note: Signet Jewelers may not be the best stock to buy. So take a peek at this free list of interesting companies with past earnings growth (and further growth forecast).
Please note, the market returns quoted in this article reflect the market weighted average returns of stocks that currently trade on American exchanges.
New: Manage All Your Stock Portfolios in One Place
We've created the ultimate portfolio companion for stock investors, and it's free.
• Connect an unlimited number of Portfolios and see your total in one currency
• Be alerted to new Warning Signs or Risks via email or mobile
• Track the Fair Value of your stocks
Have feedback on this article? Concerned about the content? Get in touch with us directly. Alternatively, email editorial-team (at) simplywallst.com.
This article by Simply Wall St is general in nature. We provide commentary based on historical data and analyst forecasts only using an unbiased methodology and our articles are not intended to be financial advice. It does not constitute a recommendation to buy or sell any stock, and does not take account of your objectives, or your financial situation. We aim to bring you long-term focused analysis driven by fundamental data. Note that our analysis may not factor in the latest price-sensitive company announcements or qualitative material. Simply Wall St has no position in any stocks mentioned.
About NYSE:SIG
Flawless balance sheet and good value.
Similar Companies
Market Insights

Advertisement
Community Narratives
Scaling up in building materials with smart M&A and growing profitability
Fair Value US$2.77|31.0% undervalued
CM
Community Contributor
Hims: The Platform Powering Personalised Healthcare
Fair Value US$114.01|53.1% undervalued
BL
Community Contributor
Undervalued lottery company with strong fundamentals
Fair Value AU$15.00|35.4% undervalued
RO
Community Contributor
Proximus, transferring money from the impatient to the patient investor
Fair Value €16.62|54.5% undervalued
AX
Community Contributor