
Advertisement
The 4.2% return this week takes Macy's' (NYSE:M) shareholders one-year gains to 212%
Unfortunately, investing is risky - companies can and do go bankrupt. But when you pick a company that is really flourishing, you can make more than 100%. For example, the Macy's, Inc. (NYSE:M) share price has soared 210% return in just a single year. Also pleasing for shareholders was the 43% gain in the last three months. This could be related to the recent financial results, released recently - you can catch up on the most recent data by reading our company report. In contrast, the longer term returns are negative, since the share price is 0.8% lower than it was three years ago.
The past week has proven to be lucrative for Macy's investors, so let's see if fundamentals drove the company's one-year performance.
See our latest analysis for Macy's
There is no denying that markets are sometimes efficient, but prices do not always reflect underlying business performance. One imperfect but simple way to consider how the market perception of a company has shifted is to compare the change in the earnings per share (EPS) with the share price movement.
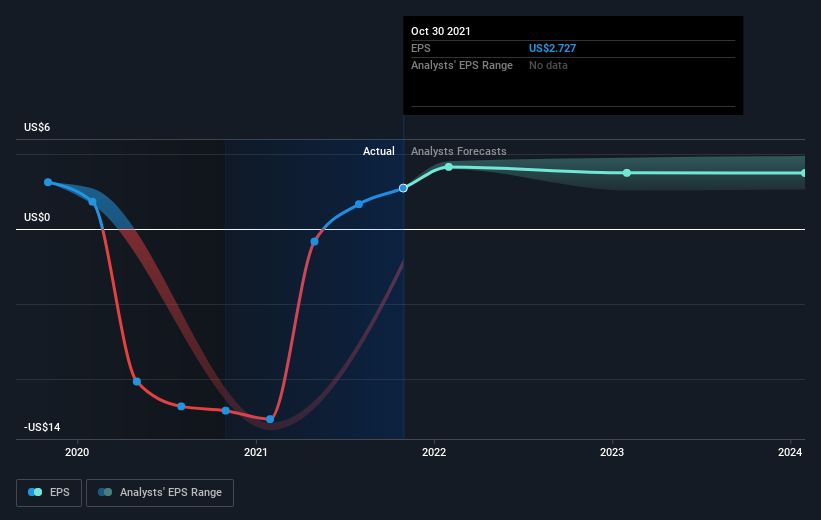
During the last year Macy's grew its earnings per share, moving from a loss to a profit.
We think the growth looks very prospective, so we're not surprised the market liked it too. Generally speaking the profitability inflection point is a great time to research a company closely, lest you miss an opportunity to profit.
You can see how EPS has changed over time in the image below (click on the chart to see the exact values).
We consider it positive that insiders have made significant purchases in the last year. Even so, future earnings will be far more important to whether current shareholders make money. This free interactive report on Macy's' earnings, revenue and cash flow is a great place to start, if you want to investigate the stock further.
What About Dividends?
As well as measuring the share price return, investors should also consider the total shareholder return (TSR). The TSR incorporates the value of any spin-offs or discounted capital raisings, along with any dividends, based on the assumption that the dividends are reinvested. Arguably, the TSR gives a more comprehensive picture of the return generated by a stock. We note that for Macy's the TSR over the last 1 year was 212%, which is better than the share price return mentioned above. This is largely a result of its dividend payments!
A Different Perspective
It's nice to see that Macy's shareholders have received a total shareholder return of 212% over the last year. That's including the dividend. That's better than the annualised return of 0.2% over half a decade, implying that the company is doing better recently. Given the share price momentum remains strong, it might be worth taking a closer look at the stock, lest you miss an opportunity. It's always interesting to track share price performance over the longer term. But to understand Macy's better, we need to consider many other factors. To that end, you should learn about the 5 warning signs we've spotted with Macy's (including 1 which shouldn't be ignored) .
Macy's is not the only stock that insiders are buying. For those who like to find winning investments this free list of growing companies with recent insider purchasing, could be just the ticket.
Please note, the market returns quoted in this article reflect the market weighted average returns of stocks that currently trade on US exchanges.
New: Manage All Your Stock Portfolios in One Place
We've created the ultimate portfolio companion for stock investors, and it's free.
• Connect an unlimited number of Portfolios and see your total in one currency
• Be alerted to new Warning Signs or Risks via email or mobile
• Track the Fair Value of your stocks
This article by Simply Wall St is general in nature. We provide commentary based on historical data and analyst forecasts only using an unbiased methodology and our articles are not intended to be financial advice. It does not constitute a recommendation to buy or sell any stock, and does not take account of your objectives, or your financial situation. We aim to bring you long-term focused analysis driven by fundamental data. Note that our analysis may not factor in the latest price-sensitive company announcements or qualitative material. Simply Wall St has no position in any stocks mentioned.
Have feedback on this article? Concerned about the content? Get in touch with us directly. Alternatively, email editorial-team (at) simplywallst.com.
About NYSE:M
Macy's
An omni-channel retail organization, operates stores, websites, and mobile applications in the United States.
Solid track record with adequate balance sheet.
Similar Companies
Market Insights

Advertisement
Community Narratives
MicroVision will explode future revenue by 380.37% with a vision towards success
Fair Value US$60.00|98.4% undervalued
TH
Community Contributor
The Indispensable Artery for a New North American Economy
Fair Value CA$132.87|1.3% undervalued
TI
Community Contributor