- United States
- /
- Specialty Stores
- /
- NYSE:HD
Why Earnings Results Show that Home Depot, Inc. (NYSE:HD) Keeps Executing and may Provide Stability For Investors

Home Depot, Inc. (NYSE:HD) just released their Q1 earnings results, and the stock seems to be doing well given the current market situation. Today, we will review earnings and compare them to the intrinsic value of the company, in order to see if the stock levels are justified.
We start off with the Home Depot Q1 Earnings highlights:
- Sales of $38.9b, up 3.8% y/y
- Net income of $4.2 billion, or $4.09 per diluted share, up 6% y/y, an 11.4% surprise vs $3.67 estimates
Management also issued fiscal 2022 guidance:
- 3% Revenue growth, in line with the 2.9% estimates
- Mid single digit EPS growth, close to the 3.8% estimated
Investors may worry about the current debt level of $39.158b, but the company has a 13% debt to market value of equity, and the quarterly $3.085b free cash flows can easily cover the $1.6b interest payments. Future refinancing of term loans may become a problem if the company increases debt too fast.
See our latest analysis for Home Depot
In the chart below, we can see how investors have been valuing the company in the last 3 years. It seems that at the beginning of 2022 the company was most optimistically valued, and the price started decreasing as interest rates grew.
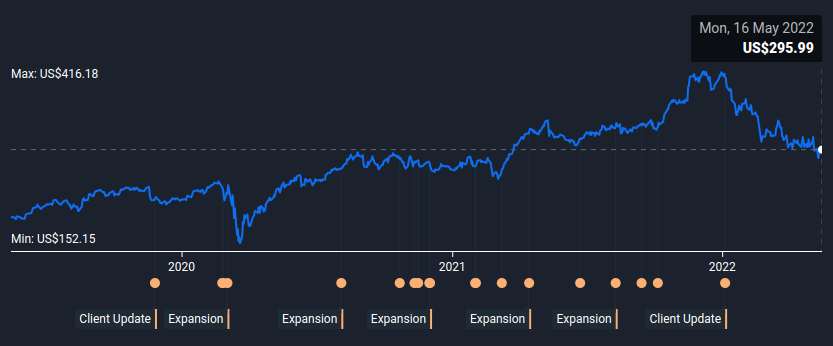
The forecasts from analysts have not significantly changed in the past, but the price of risk seems to be pressuring the stock, as well as the current uncertainty among investors for the future of the market.
Now we will see how the expected performance in the future impacts the stock price.
Home Depot Intrinsic Value
We would caution that there are many ways of valuing a company and, like the DCF, each technique has advantages and disadvantages.
In a DCF valuation, first we project what a company can make in the next 10 years, and then use a formula to estimate what it will be worth after that. We sum up both these numbers, and apply a discount to see what is the value of the cash generating assets.
You can see the full calculations in the data panel of our model.
For the next 10 years, we estimate that the cash flows are worth US$134b
We got this by growing the future cash flows by up to 9.7% with a decay function as time passes.
We also calculate the value of the company after that as a "Terminal Value":
Terminal Value (TV)= FCF2031 × (1 + g) ÷ (r – g) = US$21b× (1 + 1.9%) ÷ (6.4%– 1.9%) = US$472b
Present Value of Terminal Value (PVTV)= TV / (1 + r)10= US$472b÷ ( 1 + 6.4%)10= US$253b
Finally, we sum up those values and get the intrinsic value for Home Depot:
US$134b + US$253b = US$387b
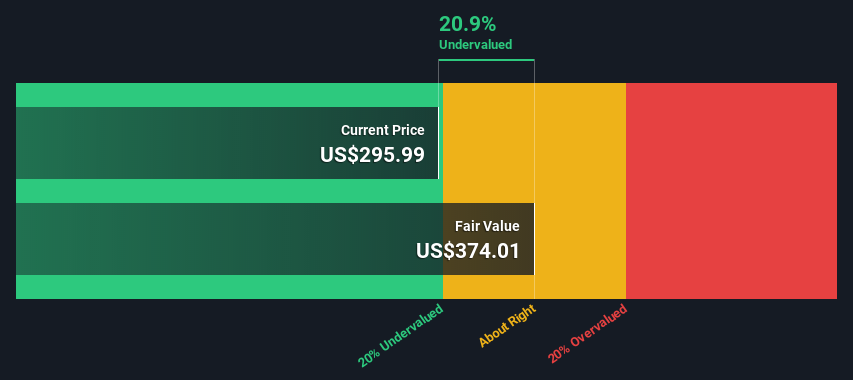
The total value is the sum of cash flows for the next ten years plus the discounted terminal value. For HD this is US$387b or US$374 per share.
Compared to the current share price of US$296, the company appears a touch undervalued at a 21% discount.
It seems that the company was trading around fair value in the beginning of 2022, however the change in interest rates has been pressuring the price.
This means that investors may have to adjust to a new value level for Home Depot, or even brace themselves for more possible rate increases.
Note that for stocks, the usual way analysts calculate the price for risk is by using the government 10 Year T-Bond yield, which is a long term rate and can move independently of the popular FED rate.
Conclusion
Home Depot is a successful, large cap stock, that will likely keep executing and improving the business.
The value of the income generating assets is mostly pressured by the rising interest rates as opposed to the growth forecasts.
Investors that want to preserve, instead of grow wealth, may find this stock attractive on a longer term horizon.
The next step is to explore the dividend income potential of Home Depot, and see if you like the stability and yield.
If you're looking to trade Home Depot, open an account with the lowest-cost platform trusted by professionals, Interactive Brokers.
With clients in over 200 countries and territories, and access to 160 markets, IBKR lets you trade stocks, options, futures, forex, bonds and funds from a single integrated account.
Enjoy no hidden fees, no account minimums, and FX conversion rates as low as 0.03%, far better than what most brokers offer.
Sponsored ContentValuation is complex, but we're here to simplify it.
Discover if Home Depot might be undervalued or overvalued with our detailed analysis, featuring fair value estimates, potential risks, dividends, insider trades, and its financial condition.
Access Free AnalysisHave feedback on this article? Concerned about the content? Get in touch with us directly. Alternatively, email editorial-team@simplywallst.com
Simply Wall St analyst Goran Damchevski and Simply Wall St have no position in any of the companies mentioned. This article is general in nature. We provide commentary based on historical data and analyst forecasts only using an unbiased methodology and our articles are not intended to be financial advice. It does not constitute a recommendation to buy or sell any stock and does not take account of your objectives, or your financial situation. We aim to bring you long-term focused analysis driven by fundamental data. Note that our analysis may not factor in the latest price-sensitive company announcements or qualitative material.

Goran Damchevski
Goran is an Equity Analyst and Writer at Simply Wall St with over 5 years of experience in financial analysis and company research. Goran previously worked in a seed-stage startup as a capital markets research analyst and product lead and developed a financial data platform for equity investors.
About NYSE:HD
Home Depot
Operates as a home improvement retailer in the United States and internationally.
Established dividend payer with adequate balance sheet.
Similar Companies
Market Insights

Community Narratives

