

David Iben put it well when he said, 'Volatility is not a risk we care about. What we care about is avoiding the permanent loss of capital.' So it seems the smart money knows that debt - which is usually involved in bankruptcies - is a very important factor, when you assess how risky a company is. Importantly, The Gap, Inc. (NYSE:GPS) does carry debt. But is this debt a concern to shareholders?
Why Does Debt Bring Risk?
Generally speaking, debt only becomes a real problem when a company can't easily pay it off, either by raising capital or with its own cash flow. If things get really bad, the lenders can take control of the business. However, a more frequent (but still costly) occurrence is where a company must issue shares at bargain-basement prices, permanently diluting shareholders, just to shore up its balance sheet. Having said that, the most common situation is where a company manages its debt reasonably well - and to its own advantage. When we examine debt levels, we first consider both cash and debt levels, together.
Check out our latest analysis for Gap
What Is Gap's Net Debt?
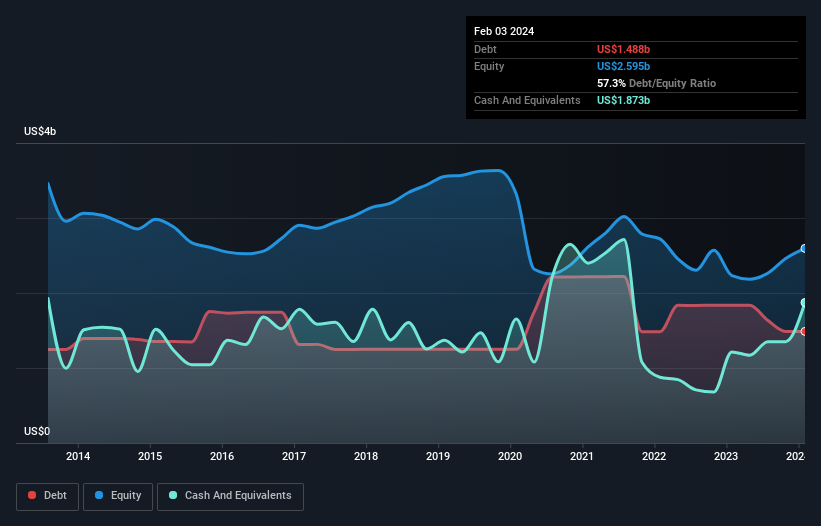
You can click the graphic below for the historical numbers, but it shows that Gap had US$1.49b of debt in February 2024, down from US$1.84b, one year before. However, its balance sheet shows it holds US$1.87b in cash, so it actually has US$385.0m net cash.
A Look At Gap's Liabilities
Zooming in on the latest balance sheet data, we can see that Gap had liabilities of US$3.10b due within 12 months and liabilities of US$5.35b due beyond that. Offsetting these obligations, it had cash of US$1.87b as well as receivables valued at US$289.0m due within 12 months. So it has liabilities totalling US$6.29b more than its cash and near-term receivables, combined.
This is a mountain of leverage relative to its market capitalization of US$8.37b. This suggests shareholders would be heavily diluted if the company needed to shore up its balance sheet in a hurry. Despite its noteworthy liabilities, Gap boasts net cash, so it's fair to say it does not have a heavy debt load!
It was also good to see that despite losing money on the EBIT line last year, Gap turned things around in the last 12 months, delivering and EBIT of US$611m. There's no doubt that we learn most about debt from the balance sheet. But ultimately the future profitability of the business will decide if Gap can strengthen its balance sheet over time. So if you're focused on the future you can check out this free report showing analyst profit forecasts.
Finally, a company can only pay off debt with cold hard cash, not accounting profits. While Gap has net cash on its balance sheet, it's still worth taking a look at its ability to convert earnings before interest and tax (EBIT) to free cash flow, to help us understand how quickly it is building (or eroding) that cash balance. Over the last year, Gap actually produced more free cash flow than EBIT. That sort of strong cash conversion gets us as excited as the crowd when the beat drops at a Daft Punk concert.
Summing Up
Although Gap's balance sheet isn't particularly strong, due to the total liabilities, it is clearly positive to see that it has net cash of US$385.0m. And it impressed us with free cash flow of US$1.1b, being 182% of its EBIT. So we don't have any problem with Gap's use of debt. When analysing debt levels, the balance sheet is the obvious place to start. But ultimately, every company can contain risks that exist outside of the balance sheet. For instance, we've identified 1 warning sign for Gap that you should be aware of.
If you're interested in investing in businesses that can grow profits without the burden of debt, then check out this free list of growing businesses that have net cash on the balance sheet.
If you're looking to trade Gap, open an account with the lowest-cost platform trusted by professionals, Interactive Brokers.
With clients in over 200 countries and territories, and access to 160 markets, IBKR lets you trade stocks, options, futures, forex, bonds and funds from a single integrated account.
Enjoy no hidden fees, no account minimums, and FX conversion rates as low as 0.03%, far better than what most brokers offer.
Sponsored ContentNew: Manage All Your Stock Portfolios in One Place
We've created the ultimate portfolio companion for stock investors, and it's free.
• Connect an unlimited number of Portfolios and see your total in one currency
• Be alerted to new Warning Signs or Risks via email or mobile
• Track the Fair Value of your stocks
Have feedback on this article? Concerned about the content? Get in touch with us directly. Alternatively, email editorial-team (at) simplywallst.com.
This article by Simply Wall St is general in nature. We provide commentary based on historical data and analyst forecasts only using an unbiased methodology and our articles are not intended to be financial advice. It does not constitute a recommendation to buy or sell any stock, and does not take account of your objectives, or your financial situation. We aim to bring you long-term focused analysis driven by fundamental data. Note that our analysis may not factor in the latest price-sensitive company announcements or qualitative material. Simply Wall St has no position in any stocks mentioned.
About NYSE:GAP
Outstanding track record and good value.
Similar Companies
Market Insights

Community Narratives
