
Advertisement
- United States
- /
- Specialty Stores
- /
- NYSE:ABG
We Think Asbury Automotive Group (NYSE:ABG) Is Taking Some Risk With Its Debt

The external fund manager backed by Berkshire Hathaway's Charlie Munger, Li Lu, makes no bones about it when he says 'The biggest investment risk is not the volatility of prices, but whether you will suffer a permanent loss of capital.' When we think about how risky a company is, we always like to look at its use of debt, since debt overload can lead to ruin. We note that Asbury Automotive Group, Inc. (NYSE:ABG) does have debt on its balance sheet. But the real question is whether this debt is making the company risky.
When Is Debt Dangerous?
Debt and other liabilities become risky for a business when it cannot easily fulfill those obligations, either with free cash flow or by raising capital at an attractive price. Part and parcel of capitalism is the process of 'creative destruction' where failed businesses are mercilessly liquidated by their bankers. However, a more frequent (but still costly) occurrence is where a company must issue shares at bargain-basement prices, permanently diluting shareholders, just to shore up its balance sheet. By replacing dilution, though, debt can be an extremely good tool for businesses that need capital to invest in growth at high rates of return. When we think about a company's use of debt, we first look at cash and debt together.
View our latest analysis for Asbury Automotive Group
How Much Debt Does Asbury Automotive Group Carry?
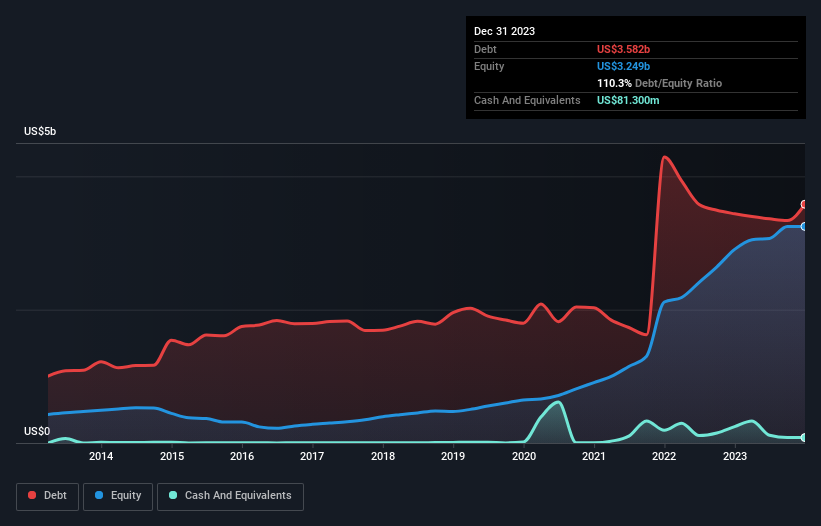
You can click the graphic below for the historical numbers, but it shows that as of September 2023 Asbury Automotive Group had US$3.58b of debt, an increase on US$3.44b, over one year. On the flip side, it has US$81.3m in cash leading to net debt of about US$3.50b.
How Healthy Is Asbury Automotive Group's Balance Sheet?
We can see from the most recent balance sheet that Asbury Automotive Group had liabilities of US$994.5m falling due within a year, and liabilities of US$4.01b due beyond that. Offsetting this, it had US$81.3m in cash and US$204.6m in receivables that were due within 12 months. So its liabilities outweigh the sum of its cash and (near-term) receivables by US$4.72b.
When you consider that this deficiency exceeds the company's US$4.29b market capitalization, you might well be inclined to review the balance sheet intently. Hypothetically, extremely heavy dilution would be required if the company were forced to pay down its liabilities by raising capital at the current share price.
We measure a company's debt load relative to its earnings power by looking at its net debt divided by its earnings before interest, tax, depreciation, and amortization (EBITDA) and by calculating how easily its earnings before interest and tax (EBIT) cover its interest expense (interest cover). This way, we consider both the absolute quantum of the debt, as well as the interest rates paid on it.
Asbury Automotive Group's debt is 3.1 times its EBITDA, and its EBIT cover its interest expense 6.5 times over. Taken together this implies that, while we wouldn't want to see debt levels rise, we think it can handle its current leverage. Unfortunately, Asbury Automotive Group's EBIT flopped 15% over the last four quarters. If earnings continue to decline at that rate then handling the debt will be more difficult than taking three children under 5 to a fancy pants restaurant. The balance sheet is clearly the area to focus on when you are analysing debt. But ultimately the future profitability of the business will decide if Asbury Automotive Group can strengthen its balance sheet over time. So if you want to see what the professionals think, you might find this free report on analyst profit forecasts to be interesting.
Finally, while the tax-man may adore accounting profits, lenders only accept cold hard cash. So it's worth checking how much of that EBIT is backed by free cash flow. Over the most recent three years, Asbury Automotive Group recorded free cash flow worth 59% of its EBIT, which is around normal, given free cash flow excludes interest and tax. This cold hard cash means it can reduce its debt when it wants to.
Our View
On the face of it, Asbury Automotive Group's level of total liabilities left us tentative about the stock, and its EBIT growth rate was no more enticing than the one empty restaurant on the busiest night of the year. But at least it's pretty decent at converting EBIT to free cash flow; that's encouraging. Overall, we think it's fair to say that Asbury Automotive Group has enough debt that there are some real risks around the balance sheet. If all goes well, that should boost returns, but on the flip side, the risk of permanent capital loss is elevated by the debt. There's no doubt that we learn most about debt from the balance sheet. But ultimately, every company can contain risks that exist outside of the balance sheet. To that end, you should learn about the 3 warning signs we've spotted with Asbury Automotive Group (including 1 which is potentially serious) .
If, after all that, you're more interested in a fast growing company with a rock-solid balance sheet, then check out our list of net cash growth stocks without delay.
New: Manage All Your Stock Portfolios in One Place
We've created the ultimate portfolio companion for stock investors, and it's free.
• Connect an unlimited number of Portfolios and see your total in one currency
• Be alerted to new Warning Signs or Risks via email or mobile
• Track the Fair Value of your stocks
Have feedback on this article? Concerned about the content? Get in touch with us directly. Alternatively, email editorial-team (at) simplywallst.com.
This article by Simply Wall St is general in nature. We provide commentary based on historical data and analyst forecasts only using an unbiased methodology and our articles are not intended to be financial advice. It does not constitute a recommendation to buy or sell any stock, and does not take account of your objectives, or your financial situation. We aim to bring you long-term focused analysis driven by fundamental data. Note that our analysis may not factor in the latest price-sensitive company announcements or qualitative material. Simply Wall St has no position in any stocks mentioned.
About NYSE:ABG
Asbury Automotive Group
Operates as an automotive retailer in the United States.
Undervalued with mediocre balance sheet.
Similar Companies
Market Insights


Advertisement
Community Narratives
Pole position to benefit from GENIUS Act
Fair Value US$233.04|59.1% undervalued
CH
Community Contributor
IREN will transform from bitcoin miner to leader in AI infrastructure
Fair Value US$21.48|15.5% undervalued
KA
Community Contributor
Behind the Assay: XRF Scientific’s Role in Modern Mining Economics
Fair Value AU$2.10|0% overvalued
RO
Community Contributor