- United States
- /
- Specialty Stores
- /
- NYSE:AAP
Advance Auto Parts' (NYSE:AAP) investors will be pleased with their notable 75% return over the last five years


Stock pickers are generally looking for stocks that will outperform the broader market. And the truth is, you can make significant gains if you buy good quality businesses at the right price. For example, the Advance Auto Parts, Inc. (NYSE:AAP) share price is up 66% in the last 5 years, clearly besting the market return of around 35% (ignoring dividends).
Let's take a look at the underlying fundamentals over the longer term, and see if they've been consistent with shareholders returns.
Though if you're not interested in researching what drove AAP's performance, we have a free list of interesting investing ideas to potentially inspire your next investment!
While the efficient markets hypothesis continues to be taught by some, it has been proven that markets are over-reactive dynamic systems, and investors are not always rational. One way to examine how market sentiment has changed over time is to look at the interaction between a company's share price and its earnings per share (EPS).
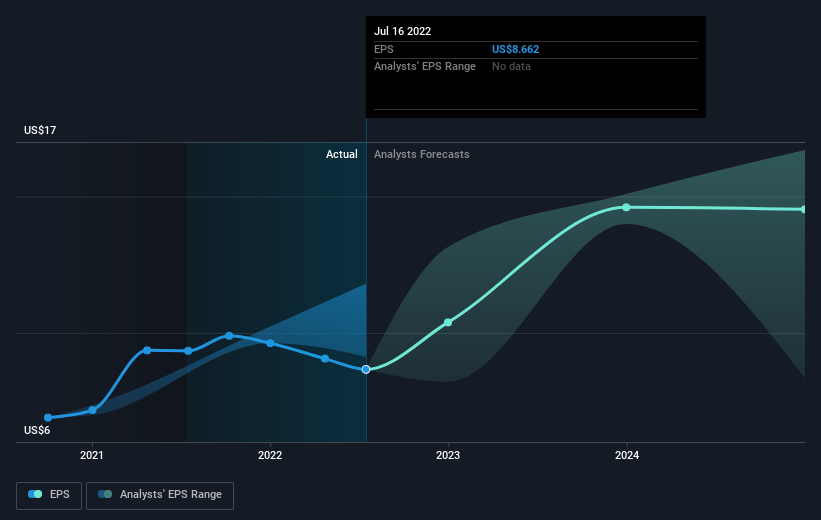
During five years of share price growth, Advance Auto Parts achieved compound earnings per share (EPS) growth of 12% per year. This EPS growth is reasonably close to the 11% average annual increase in the share price. Therefore one could conclude that sentiment towards the shares hasn't morphed very much. In fact, the share price seems to largely reflect the EPS growth.
The graphic below depicts how EPS has changed over time (unveil the exact values by clicking on the image).
This free interactive report on Advance Auto Parts' earnings, revenue and cash flow is a great place to start, if you want to investigate the stock further.
What About Dividends?
As well as measuring the share price return, investors should also consider the total shareholder return (TSR). The TSR is a return calculation that accounts for the value of cash dividends (assuming that any dividend received was reinvested) and the calculated value of any discounted capital raisings and spin-offs. Arguably, the TSR gives a more comprehensive picture of the return generated by a stock. In the case of Advance Auto Parts, it has a TSR of 75% for the last 5 years. That exceeds its share price return that we previously mentioned. The dividends paid by the company have thusly boosted the total shareholder return.
A Different Perspective
Advance Auto Parts shareholders are down 23% over twelve months (even including dividends), which isn't far from the market return of -22%. The silver lining is that longer term investors would have made a total return of 12% per year over half a decade. If the stock price has been impacted by changing sentiment, rather than deteriorating business conditions, it could spell opportunity. While it is well worth considering the different impacts that market conditions can have on the share price, there are other factors that are even more important. Case in point: We've spotted 1 warning sign for Advance Auto Parts you should be aware of.
Of course, you might find a fantastic investment by looking elsewhere. So take a peek at this free list of companies we expect will grow earnings.
Please note, the market returns quoted in this article reflect the market weighted average returns of stocks that currently trade on US exchanges.
If you're looking to trade Advance Auto Parts, open an account with the lowest-cost platform trusted by professionals, Interactive Brokers.
With clients in over 200 countries and territories, and access to 160 markets, IBKR lets you trade stocks, options, futures, forex, bonds and funds from a single integrated account.
Enjoy no hidden fees, no account minimums, and FX conversion rates as low as 0.03%, far better than what most brokers offer.
Sponsored ContentNew: Manage All Your Stock Portfolios in One Place
We've created the ultimate portfolio companion for stock investors, and it's free.
• Connect an unlimited number of Portfolios and see your total in one currency
• Be alerted to new Warning Signs or Risks via email or mobile
• Track the Fair Value of your stocks
Have feedback on this article? Concerned about the content? Get in touch with us directly. Alternatively, email editorial-team (at) simplywallst.com.
This article by Simply Wall St is general in nature. We provide commentary based on historical data and analyst forecasts only using an unbiased methodology and our articles are not intended to be financial advice. It does not constitute a recommendation to buy or sell any stock, and does not take account of your objectives, or your financial situation. We aim to bring you long-term focused analysis driven by fundamental data. Note that our analysis may not factor in the latest price-sensitive company announcements or qualitative material. Simply Wall St has no position in any stocks mentioned.
About NYSE:AAP
Advance Auto Parts
Engages in the provision of automotive aftermarket parts in the United States and internationally.
Good value with moderate growth potential.
Similar Companies
Market Insights

Community Narratives


