- United States
- /
- Specialty Stores
- /
- NYSE:AAP
Advance Auto Parts, Inc.'s (NYSE:AAP) 49% Price Boost Is Out Of Tune With Revenues


Advance Auto Parts, Inc. (NYSE:AAP) shares have had a really impressive month, gaining 49% after a shaky period beforehand. Unfortunately, the gains of the last month did little to right the losses of the last year with the stock still down 29% over that time.
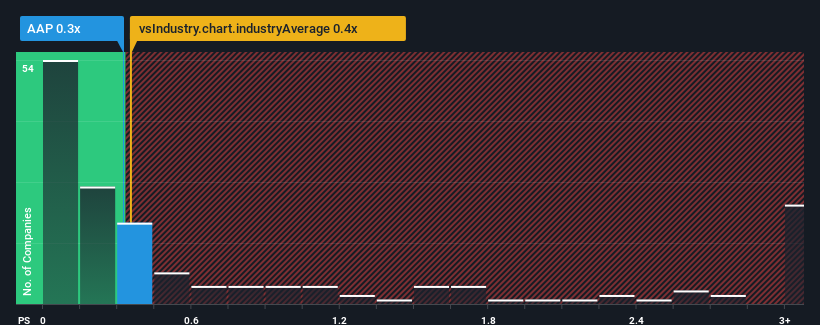
Although its price has surged higher, you could still be forgiven for feeling indifferent about Advance Auto Parts' P/S ratio of 0.3x, since the median price-to-sales (or "P/S") ratio for the Specialty Retail industry in the United States is also close to 0.4x. However, investors might be overlooking a clear opportunity or potential setback if there is no rational basis for the P/S.
Our free stock report includes 2 warning signs investors should be aware of before investing in Advance Auto Parts. Read for free now.View our latest analysis for Advance Auto Parts
What Does Advance Auto Parts' P/S Mean For Shareholders?
As an illustration, revenue has deteriorated at Advance Auto Parts over the last year, which is not ideal at all. One possibility is that the P/S is moderate because investors think the company might still do enough to be in line with the broader industry in the near future. If not, then existing shareholders may be a little nervous about the viability of the share price.
We don't have analyst forecasts, but you can see how recent trends are setting up the company for the future by checking out our free report on Advance Auto Parts' earnings, revenue and cash flow.How Is Advance Auto Parts' Revenue Growth Trending?
There's an inherent assumption that a company should be matching the industry for P/S ratios like Advance Auto Parts' to be considered reasonable.
Retrospectively, the last year delivered a frustrating 1.4% decrease to the company's top line. The last three years don't look nice either as the company has shrunk revenue by 18% in aggregate. So unfortunately, we have to acknowledge that the company has not done a great job of growing revenue over that time.
Weighing that medium-term revenue trajectory against the broader industry's one-year forecast for expansion of 5.0% shows it's an unpleasant look.
With this in mind, we find it worrying that Advance Auto Parts' P/S exceeds that of its industry peers. Apparently many investors in the company are way less bearish than recent times would indicate and aren't willing to let go of their stock right now. There's a good chance existing shareholders are setting themselves up for future disappointment if the P/S falls to levels more in line with the recent negative growth rates.
What Does Advance Auto Parts' P/S Mean For Investors?
Advance Auto Parts appears to be back in favour with a solid price jump bringing its P/S back in line with other companies in the industry Generally, our preference is to limit the use of the price-to-sales ratio to establishing what the market thinks about the overall health of a company.
The fact that Advance Auto Parts currently trades at a P/S on par with the rest of the industry is surprising to us since its recent revenues have been in decline over the medium-term, all while the industry is set to grow. Even though it matches the industry, we're uncomfortable with the current P/S ratio, as this dismal revenue performance is unlikely to support a more positive sentiment for long. Unless the recent medium-term conditions improve markedly, investors will have a hard time accepting the share price as fair value.
Before you take the next step, you should know about the 2 warning signs for Advance Auto Parts that we have uncovered.
If these risks are making you reconsider your opinion on Advance Auto Parts, explore our interactive list of high quality stocks to get an idea of what else is out there.
New: Manage All Your Stock Portfolios in One Place
We've created the ultimate portfolio companion for stock investors, and it's free.
• Connect an unlimited number of Portfolios and see your total in one currency
• Be alerted to new Warning Signs or Risks via email or mobile
• Track the Fair Value of your stocks
Have feedback on this article? Concerned about the content? Get in touch with us directly. Alternatively, email editorial-team (at) simplywallst.com.
This article by Simply Wall St is general in nature. We provide commentary based on historical data and analyst forecasts only using an unbiased methodology and our articles are not intended to be financial advice. It does not constitute a recommendation to buy or sell any stock, and does not take account of your objectives, or your financial situation. We aim to bring you long-term focused analysis driven by fundamental data. Note that our analysis may not factor in the latest price-sensitive company announcements or qualitative material. Simply Wall St has no position in any stocks mentioned.
About NYSE:AAP
Advance Auto Parts
Engages in the provision of automotive aftermarket parts in the United States and internationally.
Fair value with moderate growth potential.
Similar Companies
Market Insights

Community Narratives


