
Advertisement
- United States
- /
- Specialty Stores
- /
- NasdaqGS:TDUP
We Think The Compensation For ThredUp Inc.'s (NASDAQ:TDUP) CEO Looks About Right
Key Insights
- ThredUp to hold its Annual General Meeting on 21st of May
- Salary of US$980.0k is part of CEO James Reinhart's total remuneration
- The total compensation is similar to the average for the industry
- Over the past three years, ThredUp's EPS grew by 34% and over the past three years, the total shareholder return was 25%
Performance at ThredUp Inc. (NASDAQ:TDUP) has been reasonably good and CEO James Reinhart has done a decent job of steering the company in the right direction. As shareholders go into the upcoming AGM on 21st of May, CEO compensation will probably not be their focus, but rather the steps management will take to continue the growth momentum. We present our case of why we think CEO compensation looks fair.
See our latest analysis for ThredUp
How Does Total Compensation For James Reinhart Compare With Other Companies In The Industry?
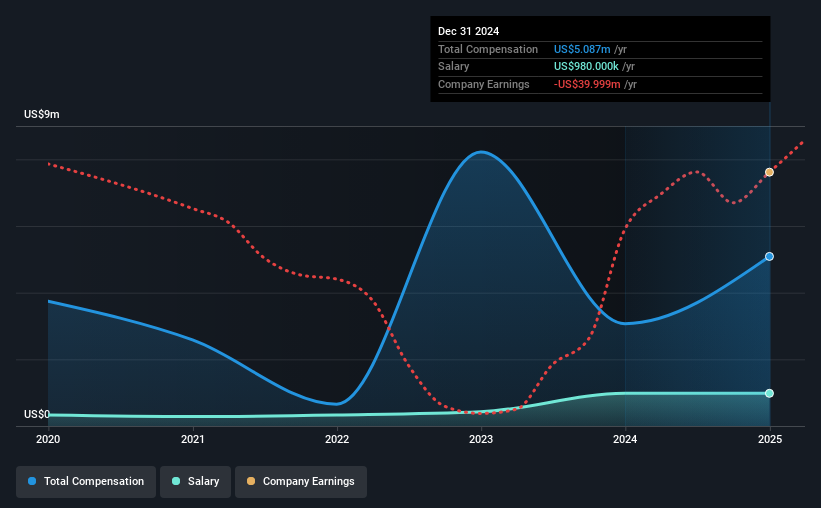
At the time of writing, our data shows that ThredUp Inc. has a market capitalization of US$730m, and reported total annual CEO compensation of US$5.1m for the year to December 2024. That's a notable increase of 66% on last year. We think total compensation is more important but our data shows that the CEO salary is lower, at US$980k.
On comparing similar companies from the American Specialty Retail industry with market caps ranging from US$400m to US$1.6b, we found that the median CEO total compensation was US$5.1m. From this we gather that James Reinhart is paid around the median for CEOs in the industry. Furthermore, James Reinhart directly owns US$29m worth of shares in the company, implying that they are deeply invested in the company's success.
| Component | 2024 | 2023 | Proportion (2024) |
| Salary | US$980k | US$980k | 19% |
| Other | US$4.1m | US$2.1m | 81% |
| Total Compensation | US$5.1m | US$3.1m | 100% |
On an industry level, around 17% of total compensation represents salary and 83% is other remuneration. It's interesting to note that ThredUp pays out a greater portion of remuneration through salary, compared to the industry. If non-salary compensation dominates total pay, it's an indicator that the executive's salary is tied to company performance.
A Look at ThredUp Inc.'s Growth Numbers
Over the past three years, ThredUp Inc. has seen its earnings per share (EPS) grow by 34% per year. Its revenue is up 8.0% over the last year.
Shareholders would be glad to know that the company has improved itself over the last few years. It's nice to see revenue heading northwards, as this is consistent with healthy business conditions. Historical performance can sometimes be a good indicator on what's coming up next but if you want to peer into the company's future you might be interested in this free visualization of analyst forecasts.
Has ThredUp Inc. Been A Good Investment?
With a total shareholder return of 25% over three years, ThredUp Inc. shareholders would, in general, be reasonably content. But they would probably prefer not to see CEO compensation far in excess of the median.
In Summary...
The company's decent performance might have made most shareholders happy, possibly making CEO remuneration the least of the concerns to be discussed in the upcoming AGM. Despite the pleasing results, we still think that any proposed increases to CEO compensation will be examined based on a case by case basis and linked to performance outcomes.
It is always advisable to analyse CEO pay, along with performing a thorough analysis of the company's key performance areas. In our study, we found 3 warning signs for ThredUp you should be aware of, and 1 of them shouldn't be ignored.
Of course, you might find a fantastic investment by looking at a different set of stocks. So take a peek at this free list of interesting companies.
Valuation is complex, but we're here to simplify it.
Discover if ThredUp might be undervalued or overvalued with our detailed analysis, featuring fair value estimates, potential risks, dividends, insider trades, and its financial condition.
Access Free AnalysisHave feedback on this article? Concerned about the content? Get in touch with us directly. Alternatively, email editorial-team (at) simplywallst.com.
This article by Simply Wall St is general in nature. We provide commentary based on historical data and analyst forecasts only using an unbiased methodology and our articles are not intended to be financial advice. It does not constitute a recommendation to buy or sell any stock, and does not take account of your objectives, or your financial situation. We aim to bring you long-term focused analysis driven by fundamental data. Note that our analysis may not factor in the latest price-sensitive company announcements or qualitative material. Simply Wall St has no position in any stocks mentioned.
About NasdaqGS:TDUP
Excellent balance sheet and fair value.
Similar Companies
Market Insights

Advertisement
Community Narratives
MicroVision will explode future revenue by 380.37% with a vision towards success
Fair Value US$60|98.4% undervalued
TH
Community Contributor
The Indispensable Artery for a New North American Economy
Fair Value CA$132.87|0.7% overvalued
TI
Community Contributor
Recently Updated Narratives
CO

composite32 on Astor Enerji ·
Astor Enerji will surge with a fair value of $140.43 in the next 3 years
Fair Value:₺140.4335.5% undervalued
1 followerusers have followed this narrative
0 commentsusers have commented on this narrative
0 likesusers have liked this narrative
RE

RecMag on Proximus ·
Proximus: The State-Backed Backup Plan with 7% Gross Yield and 15% Currency Upside.
Fair Value:€17.1356.7% undervalued
30 followersusers have followed this narrative
0 commentsusers have commented on this narrative
0 likesusers have liked this narrative
AG


Agricola on IMPACT Silver ·
A case for for IMPACT Silver Corp (TSXV:IPT) to reach USD $4.52 (CAD $6.16) in 2026 (23 bagger in 1 year) and USD $5.76 (CAD $7.89) by 2030
Fair Value:CA$7.8996.2% undervalued
1 followerusers have followed this narrative
0 commentsusers have commented on this narrative
0 likesusers have liked this narrative
Popular Narratives
TH

TheWallstreetKing on MicroVision ·
MicroVision will explode future revenue by 380.37% with a vision towards success
Fair Value:US$6098.4% undervalued
101 followersusers have followed this narrative
10 commentsusers have commented on this narrative
20 likesusers have liked this narrative
AN


AnalystConsensusTarget on NVIDIA ·
NVDA: Expanding AI Demand Will Drive Major Data Center Investments Through 2026
Fair Value:US$250.3929.3% undervalued
932 followersusers have followed this narrative
6 commentsusers have commented on this narrative
23 likesusers have liked this narrative
OS


oscargarcia on Alphabet ·
The company that turned a verb into a global necessity and basically runs the modern internet, digital ads, smartphones, maps, and AI.
Fair Value:US$3405.8% undervalued
139 followersusers have followed this narrative
6 commentsusers have commented on this narrative
18 likesusers have liked this narrative