
Advertisement
- United States
- /
- Specialty Stores
- /
- NasdaqGS:MNRO
Capital Allocation Trends At Monro (NASDAQ:MNRO) Aren't Ideal

Ignoring the stock price of a company, what are the underlying trends that tell us a business is past the growth phase? Typically, we'll see the trend of both return on capital employed (ROCE) declining and this usually coincides with a decreasing amount of capital employed. This indicates to us that the business is not only shrinking the size of its net assets, but its returns are falling as well. And from a first read, things don't look too good at Monro (NASDAQ:MNRO), so let's see why.
What Is Return On Capital Employed (ROCE)?
Just to clarify if you're unsure, ROCE is a metric for evaluating how much pre-tax income (in percentage terms) a company earns on the capital invested in its business. The formula for this calculation on Monro is:
Return on Capital Employed = Earnings Before Interest and Tax (EBIT) ÷ (Total Assets - Current Liabilities)
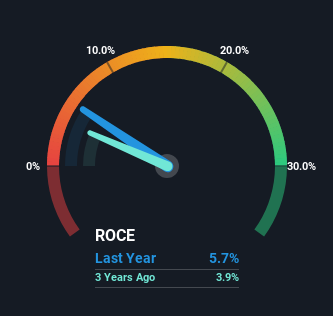
0.057 = US$70m ÷ (US$1.7b - US$487m) (Based on the trailing twelve months to December 2023).
Therefore, Monro has an ROCE of 5.7%. Ultimately, that's a low return and it under-performs the Specialty Retail industry average of 13%.
View our latest analysis for Monro
In the above chart we have measured Monro's prior ROCE against its prior performance, but the future is arguably more important. If you're interested, you can view the analysts predictions in our free analyst report for Monro .
What Does the ROCE Trend For Monro Tell Us?
We are a bit worried about the trend of returns on capital at Monro. About five years ago, returns on capital were 12%, however they're now substantially lower than that as we saw above. On top of that, it's worth noting that the amount of capital employed within the business has remained relatively steady. This combination can be indicative of a mature business that still has areas to deploy capital, but the returns received aren't as high due potentially to new competition or smaller margins. If these trends continue, we wouldn't expect Monro to turn into a multi-bagger.
On a side note, Monro's current liabilities have increased over the last five years to 28% of total assets, effectively distorting the ROCE to some degree. Without this increase, it's likely that ROCE would be even lower than 5.7%. While the ratio isn't currently too high, it's worth keeping an eye on this because if it gets particularly high, the business could then face some new elements of risk.
The Key Takeaway
In summary, it's unfortunate that Monro is generating lower returns from the same amount of capital. Long term shareholders who've owned the stock over the last five years have experienced a 63% depreciation in their investment, so it appears the market might not like these trends either. That being the case, unless the underlying trends revert to a more positive trajectory, we'd consider looking elsewhere.
Monro does have some risks, we noticed 2 warning signs (and 1 which is concerning) we think you should know about.
For those who like to invest in solid companies, check out this free list of companies with solid balance sheets and high returns on equity.
New: Manage All Your Stock Portfolios in One Place
We've created the ultimate portfolio companion for stock investors, and it's free.
• Connect an unlimited number of Portfolios and see your total in one currency
• Be alerted to new Warning Signs or Risks via email or mobile
• Track the Fair Value of your stocks
Have feedback on this article? Concerned about the content? Get in touch with us directly. Alternatively, email editorial-team (at) simplywallst.com.
This article by Simply Wall St is general in nature. We provide commentary based on historical data and analyst forecasts only using an unbiased methodology and our articles are not intended to be financial advice. It does not constitute a recommendation to buy or sell any stock, and does not take account of your objectives, or your financial situation. We aim to bring you long-term focused analysis driven by fundamental data. Note that our analysis may not factor in the latest price-sensitive company announcements or qualitative material. Simply Wall St has no position in any stocks mentioned.
About NasdaqGS:MNRO
Monro
Engages in the operation of retail tire and automotive repair stores in the United States.
Established dividend payer with moderate growth potential.
Similar Companies
Market Insights

Advertisement
Community Narratives
Pinterest will surge as advertising innovations ignite revenue growth
Fair Value US$42.63|27.5% undervalued
BR
Community Contributor
Brambles' Revenue Set to Climb 14% with Profit Margins Following
Fair Value AU$21.90|4.2% overvalued
RO
Community Contributor
Challenging Future for STG as Organic Sales Decline by 8.8%
Fair Value DKK 116.13|27.0% undervalued
KA
Community Contributor