
Advertisement
- United States
- /
- Retail Distributors
- /
- NasdaqGS:LKQ
LKQ's (NASDAQ:LKQ) earnings growth rate lags the 9.8% CAGR delivered to shareholders
The main point of investing for the long term is to make money. Better yet, you'd like to see the share price move up more than the market average. But LKQ Corporation (NASDAQ:LKQ) has fallen short of that second goal, with a share price rise of 46% over five years, which is below the market return. Unfortunately the share price is down 4.5% in the last year.
While the stock has fallen 3.8% this week, it's worth focusing on the longer term and seeing if the stocks historical returns have been driven by the underlying fundamentals.
In his essay The Superinvestors of Graham-and-Doddsville Warren Buffett described how share prices do not always rationally reflect the value of a business. One way to examine how market sentiment has changed over time is to look at the interaction between a company's share price and its earnings per share (EPS).
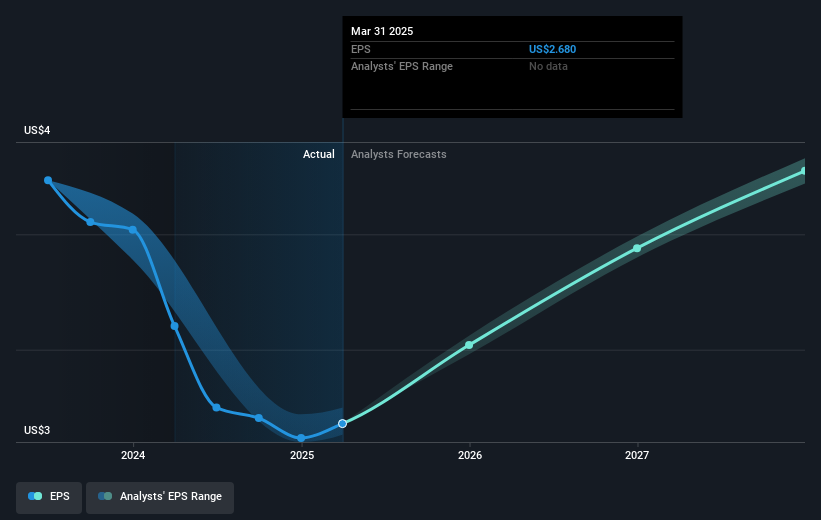
During five years of share price growth, LKQ achieved compound earnings per share (EPS) growth of 7.3% per year. This EPS growth is reasonably close to the 8% average annual increase in the share price. That suggests that the market sentiment around the company hasn't changed much over that time. In fact, the share price seems to largely reflect the EPS growth.
You can see below how EPS has changed over time (discover the exact values by clicking on the image).
It's probably worth noting we've seen significant insider buying in the last quarter, which we consider a positive. On the other hand, we think the revenue and earnings trends are much more meaningful measures of the business. It might be well worthwhile taking a look at our free report on LKQ's earnings, revenue and cash flow.
What About Dividends?
It is important to consider the total shareholder return, as well as the share price return, for any given stock. Whereas the share price return only reflects the change in the share price, the TSR includes the value of dividends (assuming they were reinvested) and the benefit of any discounted capital raising or spin-off. It's fair to say that the TSR gives a more complete picture for stocks that pay a dividend. In the case of LKQ, it has a TSR of 60% for the last 5 years. That exceeds its share price return that we previously mentioned. The dividends paid by the company have thusly boosted the total shareholder return.
A Different Perspective
LKQ shareholders are down 1.6% for the year (even including dividends), but the market itself is up 12%. However, keep in mind that even the best stocks will sometimes underperform the market over a twelve month period. Longer term investors wouldn't be so upset, since they would have made 10%, each year, over five years. If the fundamental data continues to indicate long term sustainable growth, the current sell-off could be an opportunity worth considering. While it is well worth considering the different impacts that market conditions can have on the share price, there are other factors that are even more important. Take risks, for example - LKQ has 2 warning signs we think you should be aware of.
If you like to buy stocks alongside management, then you might just love this free list of companies. (Hint: most of them are flying under the radar).
Please note, the market returns quoted in this article reflect the market weighted average returns of stocks that currently trade on American exchanges.
New: AI Stock Screener & Alerts
Our new AI Stock Screener scans the market every day to uncover opportunities.
• Dividend Powerhouses (3%+ Yield)
• Undervalued Small Caps with Insider Buying
• High growth Tech and AI Companies
Or build your own from over 50 metrics.
Have feedback on this article? Concerned about the content? Get in touch with us directly. Alternatively, email editorial-team (at) simplywallst.com.
This article by Simply Wall St is general in nature. We provide commentary based on historical data and analyst forecasts only using an unbiased methodology and our articles are not intended to be financial advice. It does not constitute a recommendation to buy or sell any stock, and does not take account of your objectives, or your financial situation. We aim to bring you long-term focused analysis driven by fundamental data. Note that our analysis may not factor in the latest price-sensitive company announcements or qualitative material. Simply Wall St has no position in any stocks mentioned.
About NasdaqGS:LKQ
LKQ
Engages in the distribution of replacement parts, components, and systems used in the repair and maintenance of vehicles and specialty vehicle aftermarket products and accessories.
Very undervalued with adequate balance sheet.
Similar Companies
Market Insights

Advertisement
Community Narratives
MicroStrategy: Volatile Gamble or Golden Opportunity?
Fair Value US$663.00|31.9% undervalued
BL
Community Contributor
Emerging Markets and Debt Reduction Will Propel Bath & Body Works Forward
Fair Value US$40.73|22.1% undervalued
ZW
Community Contributor
An amazing opportunity to potentially get a 100 bagger
Fair Value US$10.00|36.0% overvalued
DA
Community Contributor