- United States
- /
- General Merchandise and Department Stores
- /
- NasdaqGS:ETSY
Etsy, Inc.'s (NASDAQ:ETSY) Intrinsic Value Is Potentially 71% Above Its Share Price


Key Insights
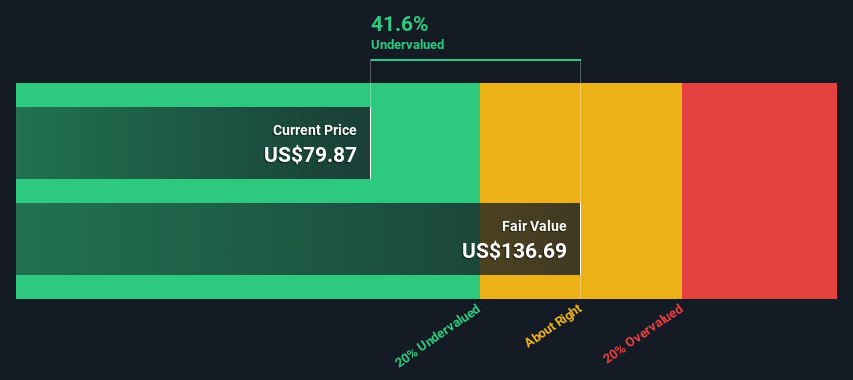
- Using the 2 Stage Free Cash Flow to Equity, Etsy fair value estimate is US$137
- Etsy is estimated to be 42% undervalued based on current share price of US$79.87
- Analyst price target for ETSY is US$113 which is 18% below our fair value estimate
Does the August share price for Etsy, Inc. (NASDAQ:ETSY) reflect what it's really worth? Today, we will estimate the stock's intrinsic value by estimating the company's future cash flows and discounting them to their present value. We will take advantage of the Discounted Cash Flow (DCF) model for this purpose. It may sound complicated, but actually it is quite simple!
We would caution that there are many ways of valuing a company and, like the DCF, each technique has advantages and disadvantages in certain scenarios. If you still have some burning questions about this type of valuation, take a look at the Simply Wall St analysis model.
Check out our latest analysis for Etsy
Is Etsy Fairly Valued?
We are going to use a two-stage DCF model, which, as the name states, takes into account two stages of growth. The first stage is generally a higher growth period which levels off heading towards the terminal value, captured in the second 'steady growth' period. In the first stage we need to estimate the cash flows to the business over the next ten years. Where possible we use analyst estimates, but when these aren't available we extrapolate the previous free cash flow (FCF) from the last estimate or reported value. We assume companies with shrinking free cash flow will slow their rate of shrinkage, and that companies with growing free cash flow will see their growth rate slow, over this period. We do this to reflect that growth tends to slow more in the early years than it does in later years.
Generally we assume that a dollar today is more valuable than a dollar in the future, so we need to discount the sum of these future cash flows to arrive at a present value estimate:
10-year free cash flow (FCF) estimate
| 2024 | 2025 | 2026 | 2027 | 2028 | 2029 | 2030 | 2031 | 2032 | 2033 | |
| Levered FCF ($, Millions) | US$800.7m | US$896.7m | US$1.18b | US$1.15b | US$1.13b | US$1.13b | US$1.13b | US$1.14b | US$1.16b | US$1.18b |
| Growth Rate Estimate Source | Analyst x10 | Analyst x7 | Analyst x5 | Analyst x5 | Est @ -1.30% | Est @ -0.26% | Est @ 0.46% | Est @ 0.97% | Est @ 1.32% | Est @ 1.57% |
| Present Value ($, Millions) Discounted @ 8.0% | US$742 | US$769 | US$939 | US$844 | US$771 | US$713 | US$663 | US$620 | US$582 | US$548 |
("Est" = FCF growth rate estimated by Simply Wall St)
Present Value of 10-year Cash Flow (PVCF) = US$7.2b
The second stage is also known as Terminal Value, this is the business's cash flow after the first stage. For a number of reasons a very conservative growth rate is used that cannot exceed that of a country's GDP growth. In this case we have used the 5-year average of the 10-year government bond yield (2.2%) to estimate future growth. In the same way as with the 10-year 'growth' period, we discount future cash flows to today's value, using a cost of equity of 8.0%.
Terminal Value (TV)= FCF2033 × (1 + g) ÷ (r – g) = US$1.2b× (1 + 2.2%) ÷ (8.0%– 2.2%) = US$21b
Present Value of Terminal Value (PVTV)= TV / (1 + r)10= US$21b÷ ( 1 + 8.0%)10= US$9.6b
The total value is the sum of cash flows for the next ten years plus the discounted terminal value, which results in the Total Equity Value, which in this case is US$17b. In the final step we divide the equity value by the number of shares outstanding. Relative to the current share price of US$79.9, the company appears quite undervalued at a 42% discount to where the stock price trades currently. Valuations are imprecise instruments though, rather like a telescope - move a few degrees and end up in a different galaxy. Do keep this in mind.
The Assumptions
Now the most important inputs to a discounted cash flow are the discount rate, and of course, the actual cash flows. Part of investing is coming up with your own evaluation of a company's future performance, so try the calculation yourself and check your own assumptions. The DCF also does not consider the possible cyclicality of an industry, or a company's future capital requirements, so it does not give a full picture of a company's potential performance. Given that we are looking at Etsy as potential shareholders, the cost of equity is used as the discount rate, rather than the cost of capital (or weighted average cost of capital, WACC) which accounts for debt. In this calculation we've used 8.0%, which is based on a levered beta of 1.162. Beta is a measure of a stock's volatility, compared to the market as a whole. We get our beta from the industry average beta of globally comparable companies, with an imposed limit between 0.8 and 2.0, which is a reasonable range for a stable business.
SWOT Analysis for Etsy
- Debt is well covered by earnings and cashflows.
- No major weaknesses identified for ETSY.
- Expected to breakeven next year.
- Has sufficient cash runway for more than 3 years based on current free cash flows.
- Trading below our estimate of fair value by more than 20%.
- Total liabilities exceed total assets, which raises the risk of financial distress.
Moving On:
Whilst important, the DCF calculation ideally won't be the sole piece of analysis you scrutinize for a company. The DCF model is not a perfect stock valuation tool. Instead the best use for a DCF model is to test certain assumptions and theories to see if they would lead to the company being undervalued or overvalued. If a company grows at a different rate, or if its cost of equity or risk free rate changes sharply, the output can look very different. Why is the intrinsic value higher than the current share price? For Etsy, we've compiled three pertinent elements you should assess:
- Risks: For example, we've discovered 2 warning signs for Etsy (1 doesn't sit too well with us!) that you should be aware of before investing here.
- Future Earnings: How does ETSY's growth rate compare to its peers and the wider market? Dig deeper into the analyst consensus number for the upcoming years by interacting with our free analyst growth expectation chart.
- Other Solid Businesses: Low debt, high returns on equity and good past performance are fundamental to a strong business. Why not explore our interactive list of stocks with solid business fundamentals to see if there are other companies you may not have considered!
PS. Simply Wall St updates its DCF calculation for every American stock every day, so if you want to find the intrinsic value of any other stock just search here.
If you're looking to trade Etsy, open an account with the lowest-cost platform trusted by professionals, Interactive Brokers.
With clients in over 200 countries and territories, and access to 160 markets, IBKR lets you trade stocks, options, futures, forex, bonds and funds from a single integrated account.
Enjoy no hidden fees, no account minimums, and FX conversion rates as low as 0.03%, far better than what most brokers offer.
Sponsored ContentValuation is complex, but we're here to simplify it.
Discover if Etsy might be undervalued or overvalued with our detailed analysis, featuring fair value estimates, potential risks, dividends, insider trades, and its financial condition.
Access Free AnalysisHave feedback on this article? Concerned about the content? Get in touch with us directly. Alternatively, email editorial-team (at) simplywallst.com.
This article by Simply Wall St is general in nature. We provide commentary based on historical data and analyst forecasts only using an unbiased methodology and our articles are not intended to be financial advice. It does not constitute a recommendation to buy or sell any stock, and does not take account of your objectives, or your financial situation. We aim to bring you long-term focused analysis driven by fundamental data. Note that our analysis may not factor in the latest price-sensitive company announcements or qualitative material. Simply Wall St has no position in any stocks mentioned.
About NasdaqGS:ETSY
Etsy
Operates two-sided online marketplaces that connect buyers and sellers worldwide.
Undervalued with imperfect balance sheet.
Similar Companies
Market Insights

Community Narratives

