- United States
- /
- REITS
- /
- NYSE:GNL
Investors in Global Net Lease (NYSE:GNL) from five years ago are still down 35%, even after 4.5% gain this past week


For many, the main point of investing is to generate higher returns than the overall market. But the main game is to find enough winners to more than offset the losers So we wouldn't blame long term Global Net Lease, Inc. (NYSE:GNL) shareholders for doubting their decision to hold, with the stock down 65% over a half decade. Shareholders have had an even rougher run lately, with the share price down 11% in the last 90 days.
The recent uptick of 4.5% could be a positive sign of things to come, so let's take a look at historical fundamentals.
See our latest analysis for Global Net Lease
Because Global Net Lease made a loss in the last twelve months, we think the market is probably more focussed on revenue and revenue growth, at least for now. Shareholders of unprofitable companies usually desire strong revenue growth. Some companies are willing to postpone profitability to grow revenue faster, but in that case one would hope for good top-line growth to make up for the lack of earnings.
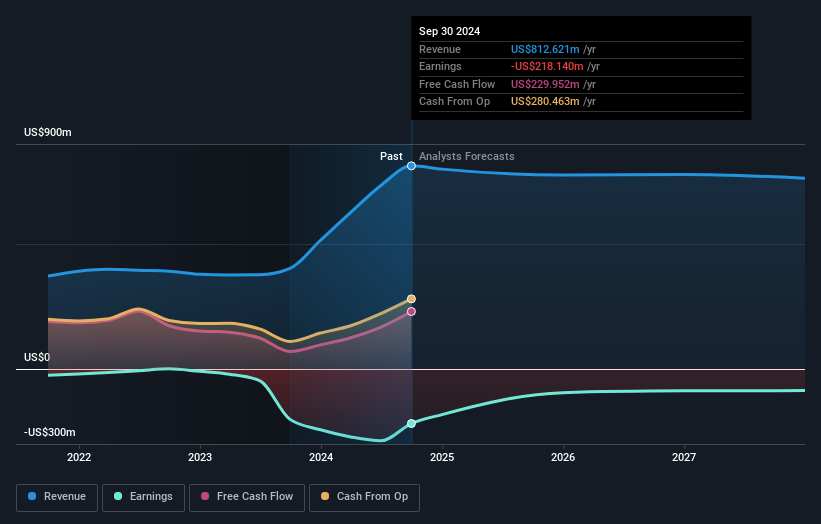
Over five years, Global Net Lease grew its revenue at 17% per year. That's better than most loss-making companies. Unfortunately for shareholders the share price has dropped 11% per year - disappointing considering the growth. It's safe to say investor expectations are more grounded now. If you think the company can keep up its revenue growth, you'd have to consider the possibility that there's an opportunity here.
You can see below how earnings and revenue have changed over time (discover the exact values by clicking on the image).
This free interactive report on Global Net Lease's balance sheet strength is a great place to start, if you want to investigate the stock further.
What About Dividends?
It is important to consider the total shareholder return, as well as the share price return, for any given stock. Whereas the share price return only reflects the change in the share price, the TSR includes the value of dividends (assuming they were reinvested) and the benefit of any discounted capital raising or spin-off. Arguably, the TSR gives a more comprehensive picture of the return generated by a stock. As it happens, Global Net Lease's TSR for the last 5 years was -35%, which exceeds the share price return mentioned earlier. The dividends paid by the company have thusly boosted the total shareholder return.
A Different Perspective
While the broader market gained around 26% in the last year, Global Net Lease shareholders lost 5.9% (even including dividends). Even the share prices of good stocks drop sometimes, but we want to see improvements in the fundamental metrics of a business, before getting too interested. However, the loss over the last year isn't as bad as the 6% per annum loss investors have suffered over the last half decade. We'd need to see some sustained improvements in the key metrics before we could muster much enthusiasm. I find it very interesting to look at share price over the long term as a proxy for business performance. But to truly gain insight, we need to consider other information, too. Even so, be aware that Global Net Lease is showing 2 warning signs in our investment analysis , and 1 of those is a bit unpleasant...
We will like Global Net Lease better if we see some big insider buys. While we wait, check out this free list of undervalued stocks (mostly small caps) with considerable, recent, insider buying.
Please note, the market returns quoted in this article reflect the market weighted average returns of stocks that currently trade on American exchanges.
New: Manage All Your Stock Portfolios in One Place
We've created the ultimate portfolio companion for stock investors, and it's free.
• Connect an unlimited number of Portfolios and see your total in one currency
• Be alerted to new Warning Signs or Risks via email or mobile
• Track the Fair Value of your stocks
Have feedback on this article? Concerned about the content? Get in touch with us directly. Alternatively, email editorial-team (at) simplywallst.com.
This article by Simply Wall St is general in nature. We provide commentary based on historical data and analyst forecasts only using an unbiased methodology and our articles are not intended to be financial advice. It does not constitute a recommendation to buy or sell any stock, and does not take account of your objectives, or your financial situation. We aim to bring you long-term focused analysis driven by fundamental data. Note that our analysis may not factor in the latest price-sensitive company announcements or qualitative material. Simply Wall St has no position in any stocks mentioned.
About NYSE:GNL
Global Net Lease
Global Net Lease, Inc. (NYSE: GNL) is a publicly traded real estate investment trust listed on the NYSE.
Good value second-rate dividend payer.
Similar Companies
Market Insights

Community Narratives

