
Advertisement
- United States
- /
- Real Estate
- /
- NYSE:RMAX
Investors five-year losses continue as RE/MAX Holdings (NYSE:RMAX) dips a further 11% this week, earnings continue to decline
Some stocks are best avoided. It hits us in the gut when we see fellow investors suffer a loss. For example, we sympathize with anyone who was caught holding RE/MAX Holdings, Inc. (NYSE:RMAX) during the five years that saw its share price drop a whopping 77%. We also note that the stock has performed poorly over the last year, with the share price down 28%. More recently, the share price has dropped a further 13% in a month.
Given the past week has been tough on shareholders, let's investigate the fundamentals and see what we can learn.
To quote Buffett, 'Ships will sail around the world but the Flat Earth Society will flourish. There will continue to be wide discrepancies between price and value in the marketplace...' One imperfect but simple way to consider how the market perception of a company has shifted is to compare the change in the earnings per share (EPS) with the share price movement.
RE/MAX Holdings became profitable within the last five years. Most would consider that to be a good thing, so it's counter-intuitive to see the share price declining. Other metrics may better explain the share price move.
In contrast to the share price, revenue has actually increased by 2.3% a year in the five year period. So it seems one might have to take closer look at the fundamentals to understand why the share price languishes. After all, there may be an opportunity.
The company's revenue and earnings (over time) are depicted in the image below (click to see the exact numbers).
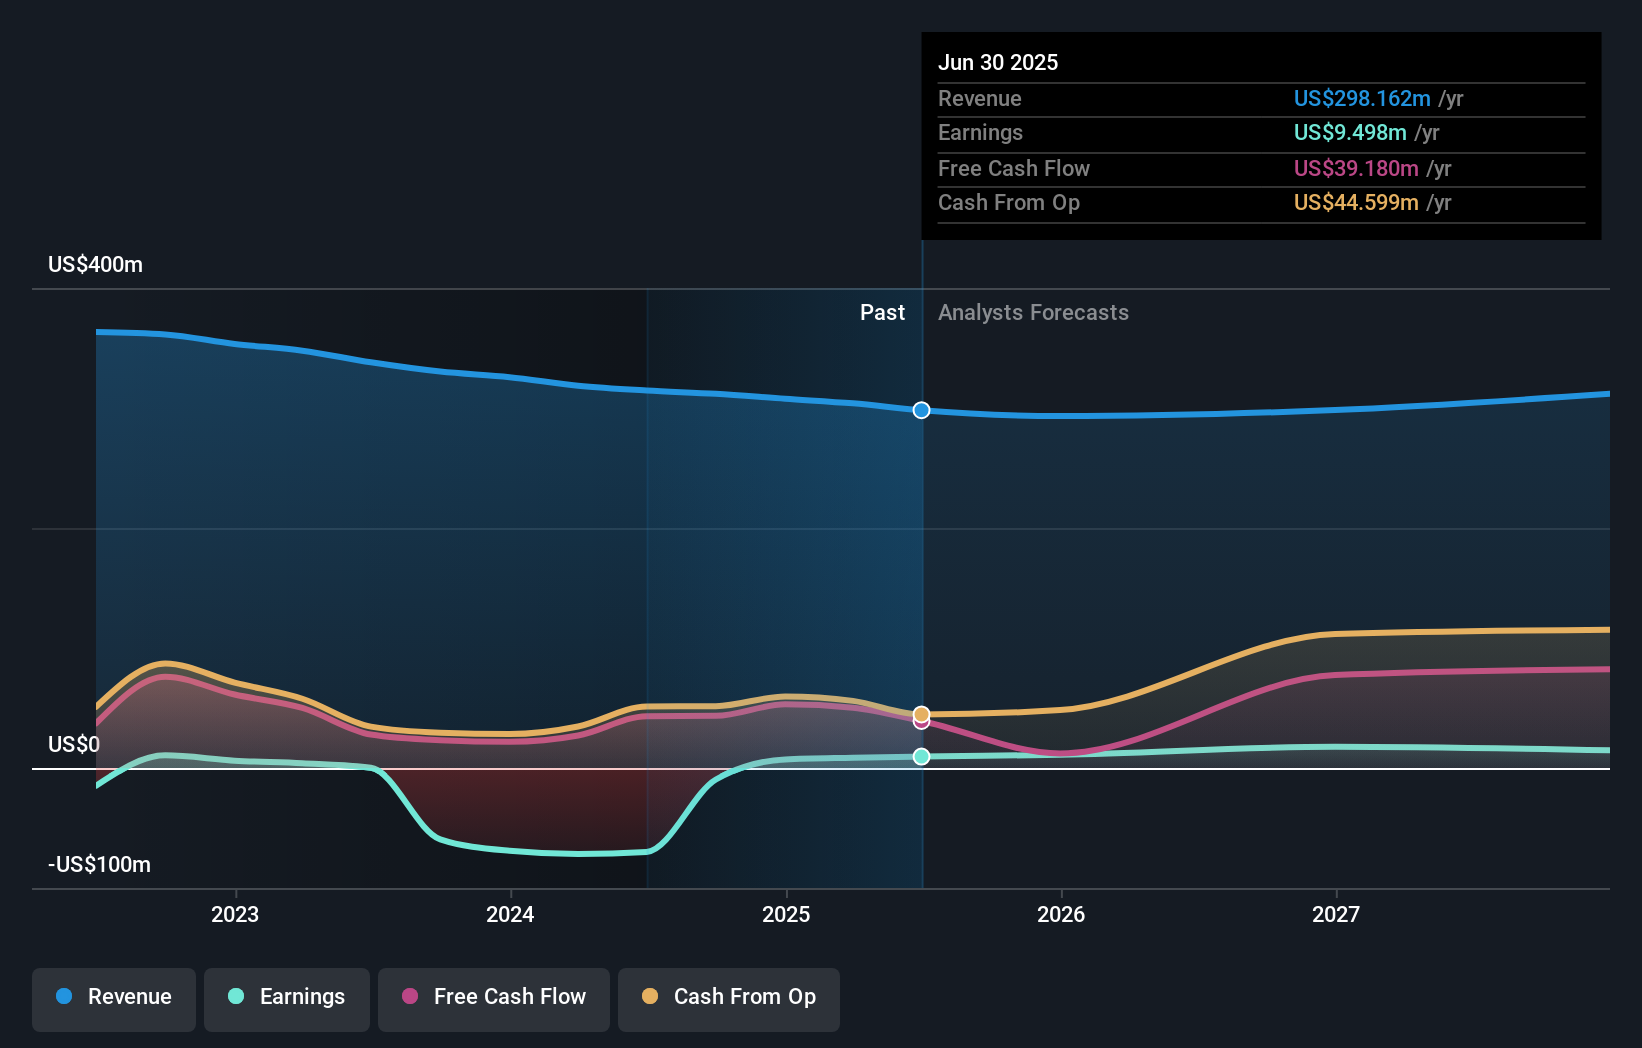
We know that RE/MAX Holdings has improved its bottom line lately, but what does the future have in store? So it makes a lot of sense to check out what analysts think RE/MAX Holdings will earn in the future (free profit forecasts).
What About The Total Shareholder Return (TSR)?
We'd be remiss not to mention the difference between RE/MAX Holdings' total shareholder return (TSR) and its share price return. The TSR attempts to capture the value of dividends (as if they were reinvested) as well as any spin-offs or discounted capital raisings offered to shareholders. Dividends have been really beneficial for RE/MAX Holdings shareholders, and that cash payout explains why its total shareholder loss of 75%, over the last 5 years, isn't as bad as the share price return.
A Different Perspective
While the broader market gained around 19% in the last year, RE/MAX Holdings shareholders lost 28%. However, keep in mind that even the best stocks will sometimes underperform the market over a twelve month period. Unfortunately, last year's performance may indicate unresolved challenges, given that it was worse than the annualised loss of 12% over the last half decade. We realise that Baron Rothschild has said investors should "buy when there is blood on the streets", but we caution that investors should first be sure they are buying a high quality business. While it is well worth considering the different impacts that market conditions can have on the share price, there are other factors that are even more important. Case in point: We've spotted 4 warning signs for RE/MAX Holdings you should be aware of, and 2 of them can't be ignored.
If you are like me, then you will not want to miss this free list of undervalued small caps that insiders are buying.
Please note, the market returns quoted in this article reflect the market weighted average returns of stocks that currently trade on American exchanges.
New: AI Stock Screener & Alerts
Our new AI Stock Screener scans the market every day to uncover opportunities.
• Dividend Powerhouses (3%+ Yield)
• Undervalued Small Caps with Insider Buying
• High growth Tech and AI Companies
Or build your own from over 50 metrics.
Have feedback on this article? Concerned about the content? Get in touch with us directly. Alternatively, email editorial-team (at) simplywallst.com.
This article by Simply Wall St is general in nature. We provide commentary based on historical data and analyst forecasts only using an unbiased methodology and our articles are not intended to be financial advice. It does not constitute a recommendation to buy or sell any stock, and does not take account of your objectives, or your financial situation. We aim to bring you long-term focused analysis driven by fundamental data. Note that our analysis may not factor in the latest price-sensitive company announcements or qualitative material. Simply Wall St has no position in any stocks mentioned.
About NYSE:RMAX
RE/MAX Holdings
Operates as a franchisor of real estate brokerage services in the United States, Canada, and internationally.
Undervalued with slight risk.
Similar Companies
Market Insights

Advertisement
Community Narratives
A formidable player in AI and enterprise computing.
Fair Value US$210.00|0.7% overvalued
CO
Community Contributor
IREN's Bold Moves in Sustainable Bitcoin Mining & AI Data Centers
Fair Value US$72.52|14.9% undervalued
BL
Community Contributor
Cooling the Champions: The Aussie Tech Behind F1's Victories
Fair Value AU$12.40|38.1% undervalued
TR
Community Contributor