- United States
- /
- Real Estate
- /
- NYSE:COMP
Does Compass Stock Offer Strong Value After Recent 21% Drop in 2025?

Reviewed by Bailey Pemberton
Thinking of what to do next with Compass stock? You’re definitely not alone. Whether you’re eyeing those price swings for the perfect entry or wondering if now is the time to hold, Compass’s recent performance has a lot to dissect. Over the past week, shares ticked down by 1.0%. Zoom out a bit and you’ll notice a bigger story: while the past month saw a drop of 21.6%, Compass is still up a compelling 25.7% year-to-date and a remarkable 23.8% over the last year. Stretch your timeline even further and the stock boasts a staggering 191.6% gain over the past three years.
What’s behind the ride? Beyond market jitters, analysts and investors are reacting to both lingering optimism from prior surges in the real estate tech sector and evolving views on Compass’s long-term role in the industry. Even with market developments churning in the background, Compass seems to be walking the fine line between growth potential and increased risk awareness. This dynamic often sets the stage for debates about valuation.
To help bring some clarity to those debates, let’s look at the numbers: Compass currently scores a 4 using our value check system, indicating the company is undervalued in four out of six key valuation areas. But beware, not all value scores are created equal. Let’s unpack those traditional valuation approaches next, and stay tuned for a smarter, more comprehensive way to evaluate whether Compass is truly worth your attention.
Approach 1: Compass Discounted Cash Flow (DCF) Analysis
A Discounted Cash Flow (DCF) model works by projecting a company’s expected future cash flows and then discounting those amounts back to today’s value. This method helps estimate what the business is truly worth based on its future cash-generating potential.
For Compass, the latest reported Free Cash Flow (FCF) stands at $139.4 Million. Analysts forecast annual increases in cash flow, projecting $378 Million by the end of 2027. Even though direct analyst estimates typically only go out five years, further free cash flow projections up to 2035 are extrapolated by Simply Wall St, with indications of continued growth.
Using these projections and discounting all future cash flows to the present, Compass’s intrinsic value is calculated at $15.24 per share according to the DCF model. Compared to the current share price, the analysis suggests the stock may be about 52.2% undervalued.
Result: UNDERVALUED
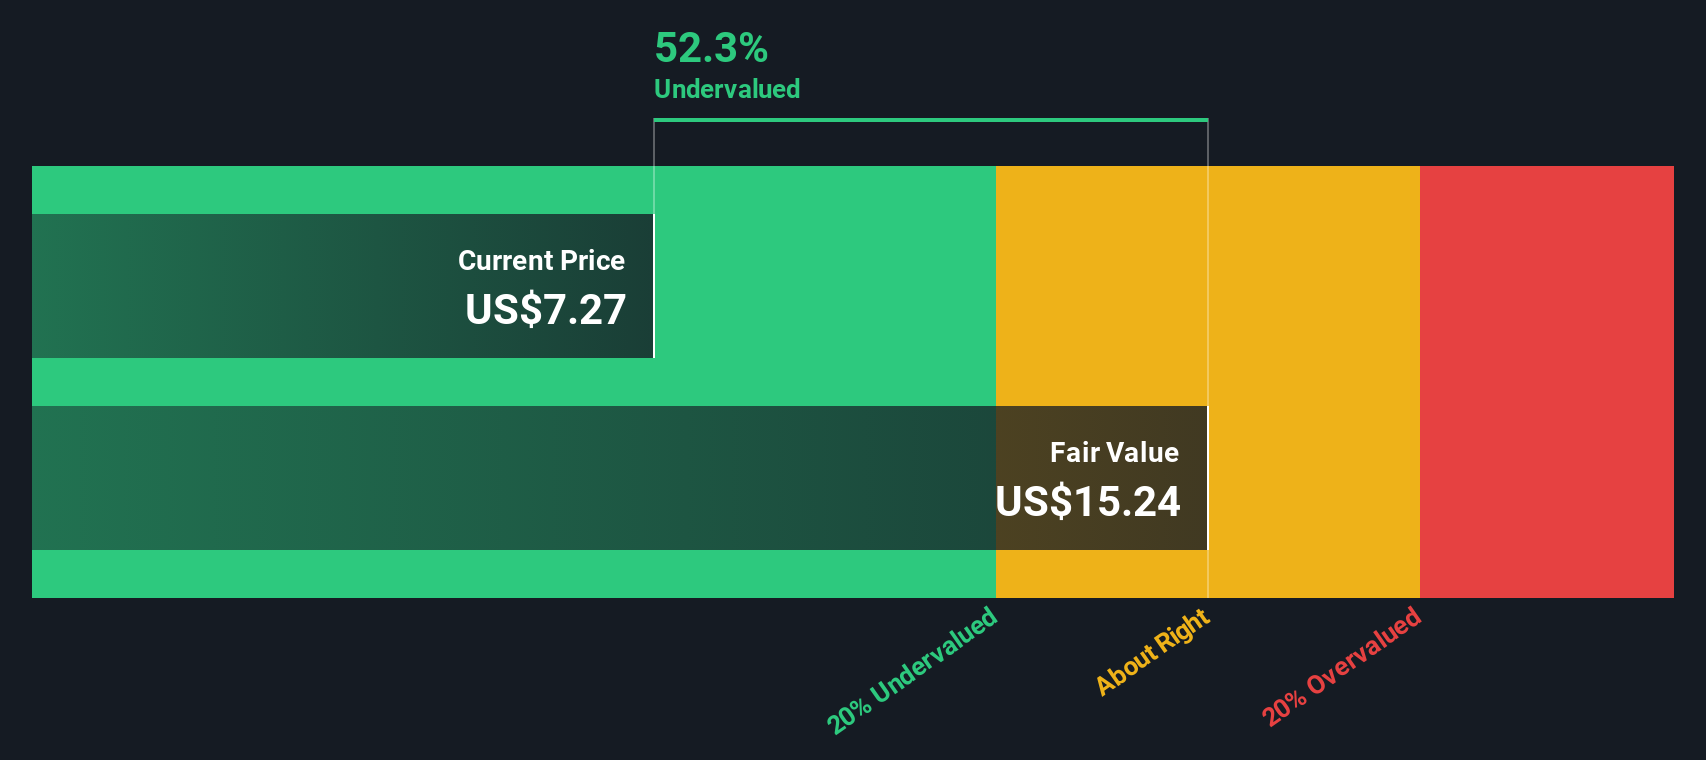
Our Discounted Cash Flow (DCF) analysis suggests Compass is undervalued by 52.2%. Track this in your watchlist or portfolio, or discover more undervalued stocks.
Approach 2: Compass Price vs Sales
The Price-to-Sales (P/S) ratio is often a preferred metric for valuing companies like Compass that may not yet be consistently profitable. This ratio focuses on the relationship between a company’s stock price and its revenue, making it especially useful for businesses in growth phases where earnings might still be negative but revenue growth is strong. Investors and analysts turn to P/S when earnings are volatile or influenced by temporary factors. It provides a clearer view of how the market values each dollar of sales.
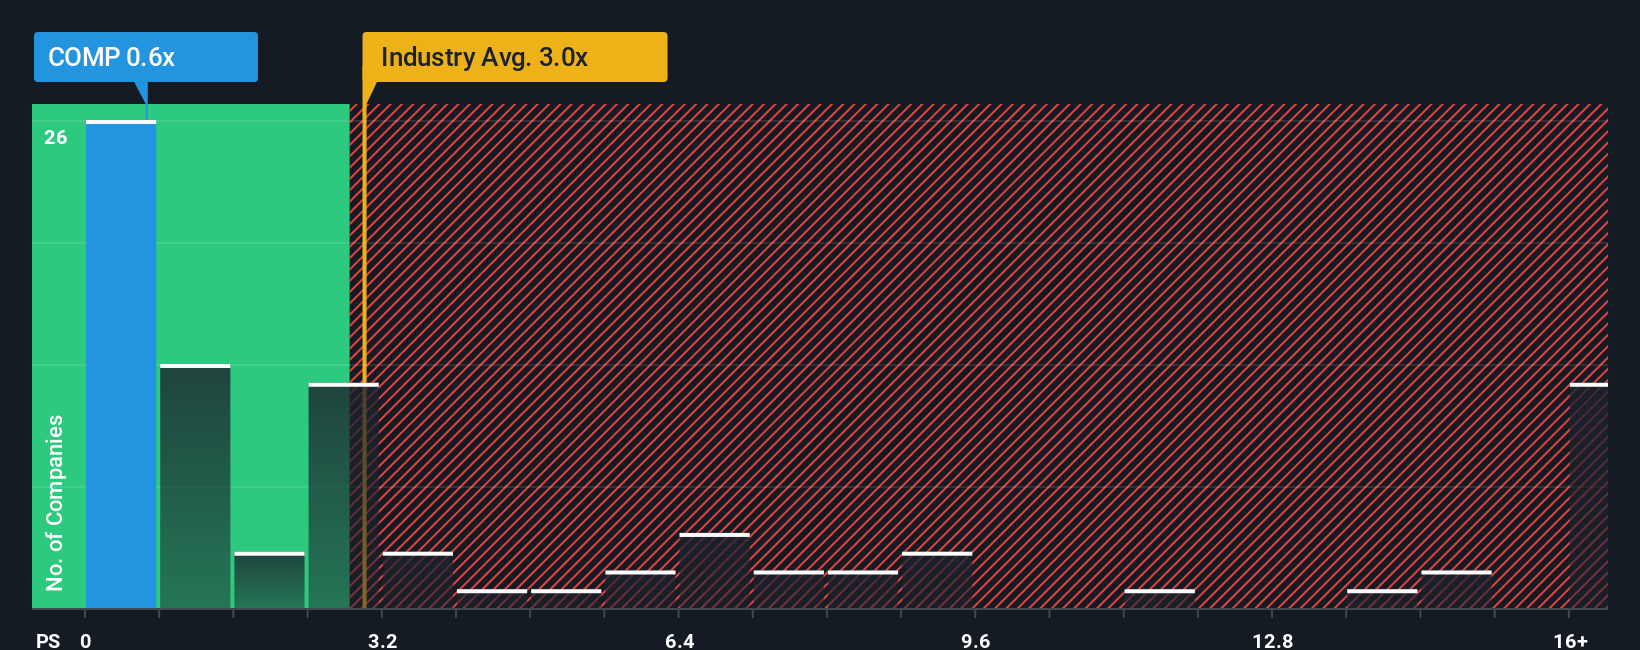
A company’s “normal” or “fair” P/S ratio depends heavily on future growth prospects and perceived risks. High-growth firms typically warrant a higher multiple, while companies facing more uncertainty or risk tend to trade at lower ratios. For Compass, the current P/S ratio stands at 0.65x. That is below both the Real Estate industry average of 2.81x and the peer average of 0.61x. This suggests the stock is trading at a discount relative to broader industry benchmarks.
Enter the Simply Wall St “Fair Ratio,” a proprietary multiple calculated for Compass that considers factors such as expected revenue growth, industry trends, profit margins, company size, and specific risk factors. Unlike standard peer and industry comparisons, the Fair Ratio tailors the assessment to Compass’s unique profile. This results in a more precise estimate of the valuation that is truly justified. For Compass, the Fair Ratio is 0.66x. Since this figure is very close to the current P/S ratio of 0.65x, it signals that Compass stock is valued just about right based on this metric.
Result: ABOUT RIGHT
PS ratios tell one story, but what if the real opportunity lies elsewhere? Discover companies where insiders are betting big on explosive growth.
Upgrade Your Decision Making: Choose your Compass Narrative
Earlier, we mentioned that there’s a better way to understand a company’s value. Let’s introduce you to Narratives. A Narrative is much more than just numbers; it is your personal investment story, combining your outlook and assumptions about Compass’s future revenue, earnings, and margins into a living analysis that explains why you think the stock is fairly priced, undervalued, or overvalued.
By connecting the company’s story to your own financial forecast, Narratives let you see how estimates lead directly to a fair value, making investment decisions more concrete and actionable. Narratives are an easy, accessible tool available to millions of investors on Simply Wall St’s Community page. They are designed to empower you whether you’re a beginner or an experienced investor.
They help you decide when to buy or sell by clearly showing where your estimated Fair Value sits versus the current share price. Additionally, your Narrative dynamically updates to reflect new information as soon as news or earnings are released, so your analysis stays relevant.
For example, on Compass, one investor might have a bullish Narrative based on aggressive AI-driven growth and set a fair value above $11, while another, worried about regulatory threats and commission models, could land closer to $7. Both Narratives update as real-world events unfold.
Do you think there's more to the story for Compass? Create your own Narrative to let the Community know!

This article by Simply Wall St is general in nature. We provide commentary based on historical data and analyst forecasts only using an unbiased methodology and our articles are not intended to be financial advice. It does not constitute a recommendation to buy or sell any stock, and does not take account of your objectives, or your financial situation. We aim to bring you long-term focused analysis driven by fundamental data. Note that our analysis may not factor in the latest price-sensitive company announcements or qualitative material. Simply Wall St has no position in any stocks mentioned.
The New Payments ETF Is Live on NASDAQ:
Money is moving to real-time rails, and a newly listed ETF now gives investors direct exposure. Fast settlement. Institutional custody. Simple access.
Explore how this launch could reshape portfolios
Sponsored ContentNew: AI Stock Screener & Alerts
Our new AI Stock Screener scans the market every day to uncover opportunities.
• Dividend Powerhouses (3%+ Yield)
• Undervalued Small Caps with Insider Buying
• High growth Tech and AI Companies
Or build your own from over 50 metrics.
Have feedback on this article? Concerned about the content? Get in touch with us directly. Alternatively, email editorial-team@simplywallst.com
About NYSE:COMP
Fair value with moderate growth potential.
Similar Companies
Market Insights

Weekly Picks

THE KINGDOM OF BROWN GOODS: WHY MGPI IS BEING CRUSHED BY INVENTORY & PRIMED FOR RESURRECTION


Why Vertical Aerospace (NYSE: EVTL) is Worth Possibly Over 13x its Current Price


The Quiet Giant That Became AI’s Power Grid
Recently Updated Narratives

Deep Value Multi Bagger Opportunity


A case for CA$31.80 (undiluted), aka 8,616% upside from CA$0.37 (an 86 bagger!).


Unicycive Therapeutics (Nasdaq: UNCY) – Preparing for a Second Shot at Bringing a New Kidney Treatment to Market (TEST)
Popular Narratives


MicroVision will explode future revenue by 380.37% with a vision towards success


NVDA: Expanding AI Demand Will Drive Major Data Center Investments Through 2026


Crazy Undervalued 42 Baggers Silver Play (Active & Running Mine)
Trending Discussion

